
A dark cloud cover signals bearish reversal when a red candle opens above, then closes below midpoint of the previous green candle.


Table of Content
A double candlestick pattern is a price-action setup formed by two consecutive candles on a price chart. Instead of analysing a single trading session in isolation, this approach focuses on how price behaves across two back-to-back sessions, offering deeper insight into changing market sentiment.
Traders closely observe these patterns because the second candle often reacts meaningfully to the first. This interaction can hint at whether buyers or sellers are beginning to gain control. Since no indicators or formulas are required, the double candlestick pattern remains a widely used concept in technical analysis.
In simple terms, traders examine the open, high, low, and close of both candles and interpret what the second candle is “saying” about the first. It may confirm the earlier move, reject it, or signal fading momentum.
A two candlestick pattern works by analysing the relationship between two consecutive candles, rather than treating each candle independently.
This is why many traders prefer 2 candlestick patterns near important price zones such as support, resistance, or trendlines.
Each candle communicates market psychology:
In the first candle, one side buyers or sellers usually show dominance. In the second candle, traders look for evidence that this dominance is strengthening or weakening, such as:
This interaction is the foundation of all double candlestick pattern interpretations.
| Aspect | Single-Candle Patterns | Double-Candle Patterns |
| Signal basis | One session | Two-session interaction |
| Clarity | Faster, noisier | Clearer confirmation |
| Risk placement | Often less defined | Cleaner invalidation levels |
| Best context | Strong trends | Reversals near key levels |
A dual candle pattern often provides more structure because the market “responds” in the second session.
Traders generally classify all double candlestick pattern setups into bullish, bearish, and neutral groups based on what the two candles suggest about direction and conviction.
| Category | Typical message | What to wait for |
| Bullish | Buying interest is improving | Higher close, break above pattern high |
| Bearish | Selling pressure is increasing | Lower close, break below pattern low |
| Neutral | Indecision, balance | Directional breakout with follow-through |
Bullish double candlestick patterns often appear after declines or during pullbacks, suggesting sellers are losing control.


A tweezer bottom indicates bullish reversal when two candles form similar lows, showing sellers losing control and buyers stepping in.
A matching low signals possible bullish reversal when two consecutive candles close at nearly the same low price level.
Bearish double candlestick patterns often form after an advance and can signal weakening demand and rising supply.

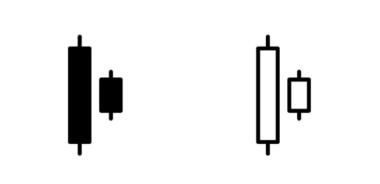
A bearish engulfing pattern signals reversal when a large red candle completely engulfs the previous green candle, showing strong selling pressure.

A bearish harami line signals possible downside reversal when a small red candle forms inside a prior strong green candle.


A tweezer top signals bearish reversal when two candles form similar highs, showing buyers losing strength and sellers stepping in.
Neutral setups point to hesitation and usually need confirmation. In some trading notes, this may be grouped as a dual candle pattern because direction is not implied until price breaks the range.
The Harami pattern refers to a potential trend reversal, where a small candle forms completely inside the previous larger candle, signaling momentum loss.

A kicking pattern is a strong reversal signal where two opposite-color candles gap apart, showing a sudden and powerful shift in market sentiment.
These patterns can help structure decisions by identifying where momentum may be shifting and by providing practical reference levels for entry and invalidation.
Two-candle signals can fail in sideways markets, during news-led volatility, or when the higher-timeframe trend remains dominant. Confirmation using trend filters, volume, and momentum tools improves selectivity.
Use a simple checklist:
A common method is to enter only after price breaks above the two-candle high for bullish setups or below the two-candle low for bearish setups. Stops are often placed beyond the opposite extreme of the pattern. Exits can be planned near prior swing levels or managed with a trailing stop aligned to a moving average.
Case Study
Now, let us look at this example.
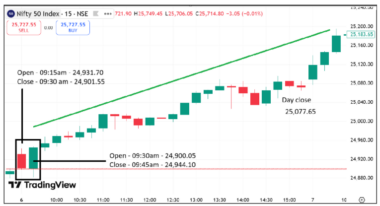
The chart above illustrates the 15-minute price action of the Nifty 50 Index on October 06, 2025. The index opened at 24,931.70 at 09:15 hours and witnessed selling pressure in the first 15 minutes, closing lower at 24,901.55 by 09:30 hours.
In the subsequent 15-minute interval, the index opened slightly below the previous close at 24,900.05, but strong buying interest emerged. Prices reversed sharply and closed higher at 24,944.10 by 09:45 hours, with the green candle completely engulfing the body of the preceding red candle. This marked the initial confirmation of a bullish engulfing pattern, indicating a potential reversal in momentum.
The confirmation was further strengthened by the next candle, which closed above the high of the engulfing candle, reinforcing bullish sentiment. Buying momentum continued throughout the session, with the index sustaining higher highs and higher lows, eventually closing the day at 25,077.65.
This setup represents a classic bullish engulfing pattern, supported by a follow-through confirmation candle. Traders acting on this signal by entering at the close of the engulfing candle (24,944.10) and exiting at the end of the trading session (25,077.65) could have captured a move of approximately 133 points.
Disclaimer : The stocks/indices shown in this blog are only for representation purpose and does not serve as an advice to invest/trade in the mentioned security.
Become a Partner & Earn up
to 1 Lakh* per Month!
A double candlestick pattern can be bullish or bearish. The direction depends on the specific two-candle formation and the market context in which it appears. Some setups indicate improving buying strength, others signal rising selling pressure, while a few remain neutral until price breaks the pattern range.
There is no universal success rate for double candlestick patterns. Their effectiveness varies based on factors such as the traded instrument, timeframe, prevailing market trend, volatility conditions, and whether confirmation tools are used. Patterns tend to perform better when aligned with trend direction and key support or resistance levels.
A double candlestick pattern is commonly referred to as a two-candlestick pattern or a two-candle setup. In some trading literature, it may also be described as a dual candle pattern, especially when the setup does not imply direction until price breaks out.
Engulfing patterns are among the most widely followed double candlestick patterns. They are considered strong because the second candle clearly overwhelms the prior session’s price action, reflecting a decisive shift in control between buyers and sellers.
Yes, the Relative Strength Index (RSI) can complement double candlestick patterns effectively. RSI helps traders assess momentum conditions, spot divergences, and filter out weaker signals, particularly when the candlestick setup suggests a potential momentum shift.
Become a Partner & Earn up
to 1 Lakh* per Month!


