21 May 2024 , 10:12 AM
WHOM SHOULD THE MARKETS BELIEVE?
For the month of April 2024, the US consumer inflation tapered by 10 bps at 3.4%; which is at par with the Bloomberg consensus estimate. However, this 10 bps fall in inflation has to be seen in perspective. In January 2024, the US consumer inflation was expected at 2.9%, but actually came in at 3.1%. Then in February 2024, the US consumer inflation inched up by 10 bps to 3.2%. Last month, in March 2024 the consumer inflation spiked by a full 30 bps to 3.5%. Since January, the US inflation has gone a full 60 bps above expectations. In that background, the 10 bps fall in inflation would not be seen as really significant. The only positive news from the April inflation numbers is that core inflation continues to taper and oil inflation is getting less vicious than previous months. But, now for the dichotomy.
Over the last few months, there is a consistent dichotomy that us building up in the market about the trajectory of interest rates. Broadly, there are 3 categories of opinion makers in the US currently. There are the likes of Micelle Bowman and Neil Kashkari who are even open to the idea of raising rates this year if inflation is not fully reined in. Bowman and Kashkari believe that the last mile inflation is likely to be a lot tougher than imagined and global and domestic factors could actually cause a spike in inflation in the coming months. Hence, raising rates cannot be ruled out. Then there the more moderate voices like vice chair Barr, Mester and Bostic; who believe that while rate cuts have to be calibrated, “higher for longer” looks the most likely option at this point in time.
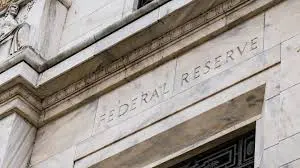
The third kind of opinion comes from the all-powerful Jerome Powell. Obviously, as the Chairperson of the Federal Reserve, his voice carries a lot of conviction. Interestingly, Powell was the only Fed member to assure the market that there would be 3 rate cuts in 2024 as committed. Today, Powell is the sold voice that has come out and said that the probability of a rate cut is much more than a rate hike at this point of time. Of course, the eventual decision will depend on the inflation data. The fact of the matter is that there are 3 distinct lines of opinion that have formed. That has surely confounded analysts and markets alike, although the CME Fedwatch continues to pencil the first rate cut in September 2024.
CORE INFLATION LOWER, ENERGY PRICES HIGHER IN APRIL 2024
For the month of April 2024, food inflation has been flat at 2.2%, while core inflation has tapered another 20 bps to 3.6%. The pressure continues to come from energy inflation, which spiked from 2.1% in March 2024 to 2.6% in April 2024. However, it must be said that with Brent crude stuck in a range, the ferocity of energy inflation is surely coming down. The table captures monthly data on the inflation break-up for April 2024 and March 2024.
| Inflation Basket
Category |
Apr 2024 (YOY) | Mar 2024 (YOY) | Inflation Basket
Category |
Apr 2024 (YOY) | Mar 2024 (YOY) |
| Food Inflation | 2.20% | 2.20% | Core Inflation | 3.60% | 3.80% |
| Food at home | 1.10% | 1.20% | Commodities less food and energy | -1.30% | -0.70% |
| · Cereals and bakery products | 0.60% | 0.20% | · Apparel | 1.30% | 0.40% |
| · Meats, poultry, fish, and eggs | 1.00% | 1.30% | · New vehicles | -0.40% | -0.10% |
| · Dairy and related products | -1.30% | -1.90% | · Used cars and trucks | -6.90% | -2.20% |
| · Fruits and vegetables | 1.70% | 2.00% | · Medical care commodities | 2.50% | 2.50% |
| · Non-alcoholic beverages | 2.30% | 2.40% | · Alcoholic beverages | 2.00% | 2.40% |
| · Other food at home | 1.40% | 1.40% | · Tobacco and smoking products | 6.70% | 6.80% |
| Food away from home | 4.10% | 4.20% | Services less energy services | 5.30% | 5.40% |
| · Full service meals and snacks | 3.40% | 3.20% | Shelter | 5.50% | 5.70% |
| · Limited service meals | 4.80% | 5.00% | · Rent of primary residence | 5.40% | 5.70% |
| Energy Inflation | 2.60% | 2.10% | · Owners’ equivalent rent | 5.80% | 5.90% |
| Energy commodities | 1.10% | 0.90% | Medical Care Services | 2.70% | 2.10% |
| · Fuel oil | –0.80% | -3.70% | · Physician Services | 0.90% | 0.70% |
| · Gasoline (all types) | 1.20% | 1.30% | · Hospital Services | 7.70% | 7.50% |
| Energy services | 3.60% | 3.10% | Transport Services | 11.20% | 10.70% |
| · Electricity | 5.10% | 5.00% | · Motor vehicle Maintenance | 7.60% | 8.20% |
| · Natural gas (piped) | -1.90% | -3.20% | · Motor vehicle insurance | 22.60% | 22.20% |
| Headline Consumer Inflation | 3.40% | 3.50% | · Airline Fare | -5.80% | -7.10% |
Data Source: US Bureau of Labour Statistics
Here, it must be noted that the Fed relies more on PCE inflation for rate decisions; than on CPI inflation. However, CPI inflation sets the basis for PCE inflation and also acts as a lead indicator. While Brent prices are hovering between $80/bbl and $90/bbl, the situation in West Asia is getting murkier with the Western world divided over supply of arms to Israel. Let us not look at the break up of yoy US inflation on a granular basis.
While the headline CPI inflation still remains 140 bps above the 2% inflation target, what is gratifying this month is that energy inflation is becoming less vicious in the overall basket.
MOM INFLATION TAPERS TO 0.3% IN APRIL 2024
The US Bureau of Labour Statistics (BLS) reports inflation on yoy basis, as well as on MOM high frequency basis. Here is the month-on-month (MOM) inflation for last 6 months.
| Month | Food (MOM) | Fuel (MOM) | Core (MOM) | Headline (MOM) |
| Nov 2023 | 0.2% | -1.6% | 0.3% | 0.2% |
| Dec 2023 | 0.2% | -0.2% | 0.3% | 0.2% |
| Jan 2024 | 0.4% | -0.9% | 0.4% | 0.3% |
| Feb 2024 | 0.0% | 2.3% | 0.4% | 0.4% |
| Mar 2024 | 0.1% | 1.1% | 0.4% | 0.4% |
| Apr 2024 | 0.0% | 1.1% | 0.3% | 0.3% |
The headline MOM inflation was flat, but there was action in the components. On an MOM basis, food inflation was up and core inflation was flat; but energy inflation was down, showing the impact of oil prices losing momentum.
APRIL 2024 CPI INFLATION HAD LIMITED IMPACT ON CME FEDWATCH
The 10 bps fall in headline inflation should have ideally made the CME Fedwatch more dovish and optimistic. However, that has not happened, and that could be partially because the inflation still remains about 140 bps away from the 2% inflation target. Also, the noises from the Fed continue to be quite confusing and ambivalent. Here is how the CME Fedwatch looked like before the inflation data was announced.
| Fed Meet | 300-325 | 325-350 | 350-375 | 375-400 | 400-425 | 425-450 | 450-475 | 475-500 | 500-525 | 525-550 |
| Jun-24 | Nil | Nil | Nil | Nil | Nil | Nil | Nil | Nil | 3.5% | 96.5% |
| Jul-24 | Nil | Nil | Nil | Nil | Nil | Nil | Nil | 0.8% | 24.6% | 74.6% |
| Sep-24 | Nil | Nil | Nil | Nil | Nil | Nil | 0.4% | 12.2% | 48.6% | 38.8% |
| Nov-24 | Nil | Nil | Nil | Nil | Nil | 0.1% | 4.5% | 24.9% | 45.2% | 25.2% |
| Dec-24 | Nil | Nil | Nil | Nil | 0.1% | 2.4% | 14.9% | 35.3% | 35.0% | 12.3% |
| Jan-25 | Nil | Nil | Nil | Nil | 1.0% | 7.5% | 23.3% | 35.2% | 25.7% | 7.3% |
| Mar-25 | Nil | Nil | Nil | 0.5% | 4.3% | 15.5% | 29.3% | 30.4% | 16.3% | 3.6% |
| Apr-25 | Nil | Nil | 0.2% | 1.9% | 8.3% | 20.4% | 29.7% | 25.4% | 11.9% | 2.3% |
| Jun-25 | Nil | 0.1% | 1.0% | 5.0% | 14.2% | 24.9% | 27.6% | 18.8% | 7.2% | 1.2% |
| Jul-25 | Nil | 0.4% | 2.3% | 8.0% | 17.7% | 25.8% | 24.7% | 15.0% | 5.2% | 0.8% |
Data source: CME Fedwatch
The above table shows how the CME Fedwatch looked ahead of the US inflation reading. The markets were expecting about 50 bps rate cut by the end of 2024 with another 50 bps happening by middle of 2025. In short, the CME Fedwatch was pegging the interest rates in the range of 4.25% to 4.50% by the middle of 2025. Did these probabilities really change after the inflation data was announced by the Bureau of Labour Statistics (BLS)? The table below captures probabilities post the inflation announcement.
| Fed Meet | 300-325 | 325-350 | 350-375 | 375-400 | 400-425 | 425-450 | 450-475 | 475-500 | 500-525 | 525-550 |
| Jun-24 | Nil | Nil | Nil | Nil | Nil | Nil | Nil | Nil | 8.9% | 91.1% |
| Jul-24 | Nil | Nil | Nil | Nil | Nil | Nil | Nil | 2.0% | 27.6% | 70.4% |
| Sep-24 | Nil | Nil | Nil | Nil | Nil | Nil | 1.0% | 14.8% | 49.0% | 35.2% |
| Nov-24 | Nil | Nil | Nil | Nil | Nil | 0.4% | 5.9% | 26.8% | 44.1% | 22.8% |
| Dec-24 | Nil | Nil | Nil | Nil | 0.2% | 3.4% | 17.4% | 36.3% | 32.4% | 10.3% |
| Jan-25 | Nil | Nil | Nil | 0.1% | 1.5% | 9.0% | 24.9% | 34.8% | 23.6% | 6.2% |
| Mar-25 | Nil | Nil | Nil | 0.8% | 5.6% | 17.7% | 30.3% | 18.7% | 14.1% | 2.8% |
| Apr-25 | Nil | Nil | 0.4% | 2.7% | 10.3% | 22.7% | 29.7% | 22.9% | 9.6% | 1.7% |
| Jun-25 | Nil | 0.2% | 1.6% | 6.8% | 16.9% | 26.4% | 26.1% | 15.8% | 5.4% | 0.8% |
| Jul-25 | 0.1% | 0.7% | 3.6% | 10.7% | 20.6% | 26.3% | 22.1% | 11.8% | 3.6% | 0.5% |
Data source: CME Fedwatch
Actually, there is not much of a difference in the CME Fedwatch probabilities before and after the inflation announcement. This could be more due to the distance that is yet to be traversed to touch 2% inflation, as well as the ambivalent voices coming from the Fed members. The markets continue to bet on 2 rate cuts by end of 2024 and 2 more rate cuts by middle of 2025, although the probabilities have slightly shifted in favour of optimism. However, that is not saying too much. The CME Fedwatch continues to assign a 57% probability to two rate cuts by the end of 2024 and a probability of 63% for 4 rate cuts by the middle of 2025.
LOWER INFLATION REVIVES RATE CUT HOPES, AND WHAT IT MEANS FOR RBI
Ahead of the inflation data, there was still a lot of uncertainty about the timing of rate cuts. With growth intact, inflation tapering and oil prices stabilizing; the markets have reasons to be optimistic that rate cuts would commence in September. One argument could still be that the target rate is 140 bps away, but then the Fed has been known to be pre-emptive on rates; both on the upside and on the downside. Unless there is a nasty spike in inflation between now and August, there chances of the first rate cut in September are very high.
For the RBI, the US consumer inflation will remain a key input as it grapples with sticky inflation in India. Even if you look at the latest inflation reading in India, the food inflation has moved higher by 18 bps, although overall inflation was down 2 bps. However, while the Fed has only held rates since the middle of 2023, RBI has been holding rates since February 2023. It is time for the RBI to show a decisive pro-growth tilt, once it is clear that the inflation monster has been substantially tamed. First and foremost, the election outcome will be known on June 04, 2024 and post the formation of the new government, the full budget is likely to be presented by middle of July. It is only after that; the RBI would be able to deliver some decisive action. That could sync with the Fed action too.
Related Tags


![]() IIFL Customer Care Number
IIFL Customer Care Number
(Gold/NCD/NBFC/Insurance/NPS)
1860-267-3000 / 7039-050-000
![]() IIFL Securities Support WhatsApp Number
IIFL Securities Support WhatsApp Number
+91 9892691696
Download The App Now
Follow us on
2024, IIFL Securities Ltd. All Rights Reserved
www.indiainfoline.com is part of the IIFL Group, a leading financial services player and a diversified NBFC. The site provides comprehensive and real time information on Indian corporates, sectors, financial markets and economy. On the site we feature industry and political leaders, entrepreneurs, and trend setters. The research, personal finance and market tutorial sections are widely followed by students, academia, corporates and investors among others.
Stock Broker SEBI Regn. No: INZ000164132, PMS SEBI Regn. No: INP000002213,IA SEBI Regn. No: INA000000623, SEBI RA Regn. No: INH000000248

This Certificate Demonstrates That IIFL As An Organization Has Defined And Put In Place Best-Practice Information Security Processes.