

Business Wire India
Anheuser-Busch InBev (Brussel:ABI) (BMV:ANB) (JSE:ANH) (NYSE:BUD):
This press release features multimedia. View the full release here: https://www.businesswire.com/news/home/20220727006135/en/
(Graphic: Business Wire)
Regulated and inside information1
Continued momentum with double-digit top-line growth
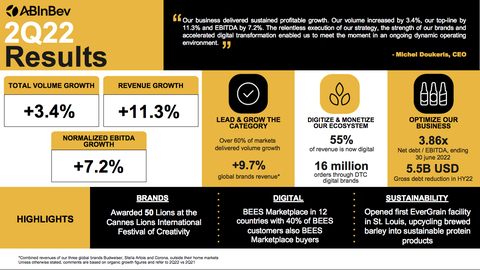
“Our business delivered sustained profitable growth. Our volume increased by 3.4%, our top-line by 11.3% and EBITDA by 7.2%. The relentless execution of our strategy, the strength of our brands and accelerated digital transformation enabled us to meet the moment in an ongoing dynamic operating environment.” - Michel Doukeris, CEO
Total Revenue
+11.3%
Revenue increased by 11.3% in 2Q22 with revenue per hl growth of 7.5% and by 11.5% in HY22 with revenue per hl growth of 7.9%.
9.7%increase in combined revenues of our global brands, Budweiser, Stella Artois and Corona, outside of their respective home markets in 2Q22, and 7.9% in HY22.
Approximately 55%of our revenue now through B2B digital platforms with the monthly active user base of BEES reaching 2.9 million users as of 30 June 2022.
Over 385 million USDof revenue and over 16 million ecommerce orders generated by our direct-to-consumer ecosystem in 2Q22.
Total Volume
+3.4%
In 2Q22, total volumes grew by 3.4%, with own beer volumes up by 2.7% and non-beer volumes up by 8.2%. In HY22, total volumes grew by 3.1% with own beer volumes up by 2.4% and non-beer volumes up by 7.1%.
Normalized EBITDA
+7.2%
In 2Q22 normalized EBITDA of 5 096 million USD represents an increase of 7.2% with normalized EBITDA margin contraction of 127 bps to 34.5%. In HY22, normalized EBITDA increased by 7.5% to 9 583 million USD and normalized EBITDA margin contracted by 122 bps to 34.2%. Normalized EBITDA figures of HY22 and HY21 include an impact of 201 million USD and 226 million USD from tax credits in Brazil. For more details, please see page 10.
Underlying Profit
1 468 million USD
Underlying profit (normalized profit attributable to equity holders of AB InBev excluding mark-to-market gains and losses linked to the hedging of our share-based payment programs and the impact of hyperinflation) was 1 468 million USD in 2Q22 compared to 1 507 million USD in 2Q21 and was 2 672 million USD in HY22 compared to 2 606 million USD in HY21.
Underlying EPS
0.73 USD
Underlying EPS was 0.73 USD in 2Q22, a decrease from 0.75 USD in 2Q21 and was 1.33 USD in HY22, an increase from 1.30 USD in HY21.
Net Debt to EBITDA
3.86x
Net debt to normalized EBITDA ratio was 3.86x at 30 June 2022 compared to 3.96x at 31 December 2021.
The 2022 Half Year Financial Report is available on our website at www.ab-inbev.com.
1The enclosed information constitutes inside information as defined in Regulation (EU) No 596/2014 of the European Parliament and of the Council of 16 April 2014 on market abuse, and regulated information as defined in the Belgian Royal Decree of 14 November 2007 regarding the duties of issuers of financial instruments which have been admitted for trading on a regulated market. For important disclaimers and notes on the basis of preparation, please refer to page 16.
Management comments
Continued momentum with double-digit top-line growth
We delivered top-line growth of 11.3%, comprised of 3.4% volume and 7.5% revenue per hl growth, driven by revenue management initiatives, ongoing premiumization and expansion of the beer category across most of our key markets supported by increased investment in our brands. EBITDA increased by 7.2% despite anticipated commodity and supply chain cost headwinds.
At the recent 2022 Cannes Lions International Festival of Creativity, we were awarded 50 Lions, a record high for our company.
Consistent execution of our strategy
We continue to execute on and invest in three key strategic pillars to deliver consistent growth and long-term value creation.
See Image 1.
1. Lead and grow the category:
This quarter we delivered volume growth in more than 60% of our markets with total volume growth of 3.4%.
2. Digitize and monetize our ecosystem:
BEES is now live in 18 markets and has reached 2.9 million monthly active users as of 30 June 2022, a 7% increase versus 1Q22. BEES Marketplace is now live in 12 countries with 40% of BEES customers now also Marketplace buyers.
3. Optimize our business:
We continued to deleverage with our net debt to normalized EBITDA ratio decreasing from 3.96x at 31 December 2021 to 3.86x for the 12-month period ending 30 June 2022. Gross debt reduced by $5.5 billion USD in HY22.
1. Lead and grow the category
We are executing on five proven and scalable levers to drive category expansion:
2. Digitize and monetize our ecosystem
3. Optimize our business
In HY22, we continued to efficiently allocate resources across our operations. This enabled further investment behind the organic growth of our business with over 5.3 billion USD in capex and sales and marketing, focused on capacity and capabilities to lead and grow the category, marketing creativity and accelerating digital transformation. Our gross debt reduced from 88.8 billion USD as of 31 December 2021 to 83.3 billion USD as of 30 June 2022, leading to a net debt to EBITDA ratio of 3.86x. Our net interest expense decreased by 134 million USD versus HY21, principally as a result of our gross debt reduction efforts.
Advancing our ESG priorities
We continue to advance our ESG agenda. In June, we commenced operations in our first EverGrain facility in St. Louis, upcycling barley used in the brewing process into high quality, sustainable protein ingredients with an annual capacity of 7 thousand tons. To drive sustainable innovation at scale, this quarter we brought together more than 250 supply chain partners with the launch of our global collaboration initiative Eclipse and, along with our CPG partners, we hosted the 3rd annual demo day of our 100+ Accelerator program. During the event, 34 startups showcased solutions to our sustainability challenges across water stewardship, climate action, smart agriculture, circular packaging and upcycling.
Creating a future with more cheers
Our business continues to build momentum and deliver consistent profitable growth even in the context of the ongoing dynamic operating environment. Our best-in-class portfolio of brands, accelerated digital transformation and global ecosystem provide a unique platform that positions us well to lead and grow the beer category and drive superior long-term value creation.
2022 Outlook
|
Figure 1. Consolidated performance (million USD) |
||||||
|
2Q21 |
2Q22 |
Organic |
||||
|
|
|
growth |
||||
|
Total Volumes (thousand hls) |
144 845 |
149 729 |
3.4% |
|||
|
AB InBev own beer |
128 625 |
131 107 |
2.7% |
|||
|
Non-beer volumes |
15 299 |
17 544 |
8.2% |
|||
|
Third party products |
921 |
1 079 |
17.2% |
|||
|
Revenue |
13 539 |
14 793 |
11.3% |
|||
|
Gross profit |
7 819 |
7 997 |
4.9% |
|||
|
Gross margin |
57.8% |
54.1% |
-329 bps |
|||
|
Normalized EBITDA |
4 846 |
5 096 |
7.2% |
|||
|
Normalized EBITDA margin |
35.8% |
34.5% |
-127 bps |
|||
|
Normalized EBIT |
3 655 |
3 811 |
6.0% |
|||
|
Normalized EBIT margin |
27.0% |
25.8% |
-123 bps |
|||
|
|
|
|
|
|||
|
Profit attributable to equity holders of AB InBev |
1 862 |
1 597 |
|
|||
|
Normalized profit attributable to equity holders of AB InBev |
1 911 |
1 519 |
|
|||
|
Underlying profit attributable to equity holders of AB InBev |
1 507 |
1 468 |
|
|||
|
|
|
|
|
|||
|
Earnings per share (USD) |
0.93 |
0.79 |
|
|||
|
Normalized earnings per share (USD) |
0.95 |
0.75 |
|
|||
|
Underlying earnings per share (USD) |
0.75 |
0.73 |
|
|||
|
|
|
|
||||
|
|
|
|
||||
|
HY21 |
HY22 |
Organic |
||||
|
|
|
growth |
||||
|
Total Volumes (thousand hls) |
280 398 |
289 074 |
3.1% |
|||
|
AB InBev own beer |
247 635 |
251 692 |
2.4% |
|||
|
Non-beer volumes |
31 243 |
35 488 |
7.1% |
|||
|
Third party products |
1 519 |
1 894 |
24.7% |
|||
|
Revenue |
25 832 |
28 027 |
11.5% |
|||
|
Gross profit |
14 869 |
15 243 |
6.1% |
|||
|
Gross margin |
57.6% |
54.4% |
-277 bps |
|||
|
Normalized EBITDA |
9 114 |
9 583 |
7.5% |
|||
|
Normalized EBITDA margin |
35.3% |
34.2% |
-122 bps |
|||
|
Normalized EBIT |
6 768 |
7 105 |
7.1% |
|||
|
Normalized EBIT margin |
26.2% |
25.4% |
-100 bps |
|||
|
|
|
|
|
|||
|
Profit attributable to equity holders of AB InBev |
2 458 |
1 692 |
|
|||
|
Normalized profit attributable to equity holders of AB InBev |
2 924 |
2 860 |
|
|||
|
Underlying profit attributable to equity holders of AB InBev |
2 606 |
2 672 |
|
|||
|
|
|
|
|
|||
|
Earnings per share (USD) |
1.23 |
0.84 |
|
|||
|
Normalized earnings per share (USD) |
1.46 |
1.42 |
|
|||
|
Underlying earnings per share (USD) |
1.30 |
1.33 |
|
Figure 2. Volumes (thousand hls) |
||||||||||||
|
2Q21 |
Scope |
Organic |
2Q22 |
Organic growth |
||||||||
|
growth |
Total Volume |
Own beer volume |
||||||||||
|
North America |
28 115 |
- |
-754 |
27 361 |
-2.7% |
-2.9% |
||||||
|
Middle Americas |
34 916 |
13 |
2 847 |
37 775 |
8.2% |
9.5% |
||||||
|
South America |
33 465 |
80 |
2 876 |
36 421 |
8.6% |
6.2% |
||||||
|
EMEA |
22 875 |
22 |
-59 |
22 838 |
-0.3% |
-0.6% |
||||||
|
Asia Pacific |
25 205 |
1 |
-109 |
25 097 |
-0.4% |
-0.2% |
||||||
|
Global Export and Holding Companies |
269 |
-116 |
85 |
238 |
55.7% |
58.5% |
||||||
|
AB InBev Worldwide |
144 845 |
- |
4 885 |
149 729 |
3.4% |
2.7% |
||||||
|
. |
||||||||||||
|
HY21 |
Scope |
Organic |
HY22 |
Organic growth |
||||||||
|
growth |
Total Volume |
Own beer volume |
||||||||||
|
North America |
53 252 |
- |
-1 804 |
51 448 |
-3.4% |
-3.0% |
||||||
|
Middle Americas |
67 980 |
22 |
4 022 |
72 024 |
5.9% |
7.0% |
||||||
|
South America |
71 929 |
151 |
4 735 |
76 815 |
6.6% |
3.7% |
||||||
|
EMEA |
40 540 |
29 |
2 392 |
42 962 |
5.9% |
5.7% |
||||||
|
Asia Pacific |
46 081 |
1 |
-698 |
45 385 |
-1.5% |
-1.5% |
||||||
|
Global Export and Holding Companies |
615 |
-204 |
29 |
440 |
6.9% |
6.4% |
||||||
|
AB InBev Worldwide |
280 398 |
- |
8 676 |
289 074 |
3.1% |
2.4% |
Key Market Performances
United States: Continued top-line growth with flattish bottom-line
Mexico: Double-digit top- and bottom-line growth
Colombia: Double-digit top-line and high-single digit bottom-line growth
Brazil: Double-digit top- and bottom-line growth
Europe: High-single digit top- and double-digit bottom-line growth
South Africa: High-single digit top-line and double-digit bottom-line growth
China: Industry impacted by COVID-19 restrictions with gradual improvement throughout the quarter
Highlights from our other markets
Consolidated Income Statement
|
Figure 3. Consolidated income statement (million USD) |
||||||
|
2Q21 |
2Q22 |
Organic |
||||
|
|
|
growth |
||||
|
Revenue |
13 539 |
14 793 |
11.3% |
|||
|
Cost of sales |
-5 720 |
-6 796 |
-19.9% |
|||
|
Gross profit |
7 819 |
7 997 |
4.9% |
|||
|
SG&A |
-4 511 |
-4 500 |
-4.1% |
|||
|
Other operating income/(expenses) |
347 |
314 |
3.4% |
|||
|
Normalized profit from operations (normalized EBIT) |
3 655 |
3 811 |
6.0% |
|||
|
Non-underlying items above EBIT |
-150 |
-9 |
|
|||
|
Net finance income/(cost) |
-755 |
-1 217 |
|
|||
|
Non-underlying net finance income/(cost) |
64 |
36 |
|
|||
|
Share of results of associates |
69 |
74 |
|
|||
|
Income tax expense |
-702 |
-721 |
|
|||
|
Profit |
2 182 |
1 975 |
|
|||
|
Profit attributable to non-controlling interest |
319 |
378 |
|
|||
|
Profit attributable to equity holders of AB InBev |
1 862 |
1 597 |
|
|||
|
|
|
|
|
|||
|
Normalized EBITDA |
4 846 |
5 096 |
7.2% |
|||
|
Normalized profit attributable to equity holders of AB InBev |
1 911 |
1 519 |
|
|||
|
|
|
|
||||
|
HY21 |
HY22 |
Organic |
||||
|
|
|
growth |
||||
|
Revenue |
25 832 |
28 027 |
11.5% |
|||
|
Cost of sales |
-10 963 |
-12 784 |
-18.7% |
|||
|
Gross profit |
14 869 |
15 243 |
6.1% |
|||
|
SG&A |
-8 571 |
-8 616 |
-5.3% |
|||
|
Other operating income/(expenses) |
470 |
478 |
9.3% |
|||
|
Normalized profit from operations (normalized EBIT) |
6 768 |
7 105 |
7.1% |
|||
|
Non-underlying items above EBIT |
-217 |
-105 |
|
|||
|
Net finance income/(cost) |
-2 047 |
-2 282 |
|
|||
|
Non-underlying net finance income/(cost) |
-299 |
14 |
|
|||
|
Share of results of associates |
100 |
129 |
|
|||
|
Non-underlying share of results of associates |
- |
-1 143 |
|
|||
|
Income tax expense |
-1 231 |
-1 244 |
|
|||
|
Profit |
3 074 |
2 474 |
|
|||
|
Profit attributable to non-controlling interest |
616 |
782 |
|
|||
|
Profit attributable to equity holders of AB InBev |
2 458 |
1 692 |
|
|||
|
|
|
|
|
|||
|
Normalized EBITDA |
9 114 |
9 583 |
7.5% |
|||
|
Normalized profit attributable to equity holders of AB InBev |
2 924 |
2 860 |
Consolidated other operating income/(expenses) in HY22 increased by 9.3% primarily driven by higher government grants. In HY22, Ambev recognized 201 million USD income in other operating income related to tax credits (HY21: 226 million USD). The net impact is presented as a scope change and does not affect the presented organic growth rates.
Non-underlying items above EBIT & Non-underlying share of results of associates
(million USD)
|
Figure 4. Non-underlying items above EBIT & Non-underlying share of results of associates (million USD) |
||||||||
|
2Q21 |
2Q22 |
HY21 |
HY22 |
|||||
|
COVID-19 costs |
-31 |
-4 |
-54 |
-13 |
||||
|
Restructuring |
-64 |
-14 |
-97 |
-51 |
||||
|
Business and asset disposal |
24 |
10 |
14 |
6 |
||||
|
Acquisition costs / Business combinations |
-6 |
- |
-6 |
- |
||||
|
AB InBev Efes related costs |
- |
-1 |
- |
-47 |
||||
|
Zenzele scheme |
-73 |
- |
-73 |
- |
||||
|
Non-underlying items in EBIT |
-150 |
-9 |
-217 |
-105 |
||||
|
Non-underlying share of results of associates |
- |
- |
- |
-1 143 |
EBIT excludes negative non-underlying items of 9 million USD in 2Q22 and 105 million USD in HY22.
Non-underlying share of results of associates includes the non-cash impairment of 1 143 million USD the company recorded on its investment in AB InBev Efes in 1Q22.
Net finance income/(cost)
|
Figure 5. Net finance income/(cost) (million USD) |
||||||||
|
2Q21 |
2Q22 |
HY21 |
HY22 |
|||||
|
Net interest expense |
-903 |
-838 |
-1 817 |
-1 683 |
||||
|
Net interest on net defined benefit liabilities |
-19 |
-19 |
-37 |
-37 |
||||
|
Accretion expense |
-142 |
-185 |
-265 |
-336 |
||||
|
Mark-to-market |
441 |
35 |
348 |
162 |
||||
|
Net interest income on Brazilian tax credits |
71 |
65 |
76 |
113 |
||||
|
Other financial results |
-204 |
-275 |
-353 |
-501 |
||||
|
Net finance income/(cost) |
-755 |
-1 217 |
-2 047 |
-2 282 |
Net finance costs in HY22 and HY21 were positively impacted by the mark-to-market gain on the hedging of our share-based payment programs. The number of shares covered by the hedging of our share-based payment programs, and the opening and closing share prices, are shown in figure 6 below.
|
Figure 6. Share-based payment hedge |
||||||||
|
2Q21 |
2Q22 |
HY21 |
HY22 |
|||||
|
Share price at the start of the period (Euro) |
53.75 |
54.26 |
57.01 |
53.17 |
||||
|
Share price at the end of the period (Euro) |
60.81 |
51.36 |
60.81 |
51.36 |
||||
|
Number of equity derivative instruments at the end of the period (millions) |
55.0 |
55.0 |
55.0 |
55.0 |
Non-underlying net finance income/(cost)
|
Figure 7. Non-underlying net finance income/(cost) (million USD) |
||||||||
|
2Q21 |
2Q22 |
HY21 |
HY22 |
|||||
|
Mark-to-market |
360 |
29 |
283 |
134 |
||||
|
Early termination fee of Bonds and Other |
-295 |
7 |
-582 |
-120 |
||||
|
Non-underlying net finance income/(cost) |
64 |
36 |
-299 |
14 |
Non-underlying net finance cost in HY22 and HY21 includes mark-to-market gains on derivative instruments entered into to hedge the shares issued in relation to the Grupo Modelo and SAB combinations.
The number of shares covered by the hedging of the deferred share instrument and the restricted shares are shown in figure 8, together with the opening and closing share prices.
|
Figure 8. Non-underlying equity derivative instruments |
||||||||
|
2Q21 |
2Q22 |
HY21 |
HY22 |
|||||
|
Share price at the start of the period (Euro) |
53.75 |
54.26 |
57.01 |
53.17 |
||||
|
Share price at the end of the period (Euro) |
60.81 |
51.36 |
60.81 |
51.36 |
||||
|
Number of equity derivative instruments at the end of the period (millions) |
45.5 |
45.5 |
45.5 |
45.5 |
Income tax expense
|
Figure 9. Income tax expense (million USD) |
||||||||
|
2Q21 |
2Q22 |
HY21 |
HY22 |
|||||
|
Income tax expense |
702 |
721 |
1 231 |
1 244 |
||||
|
Effective tax rate |
24.9% |
27.5% |
29.3% |
26.3% |
||||
|
Normalized effective tax rate |
25.6% |
29.9% |
27.3% |
27.2% |
||||
|
Normalized effective tax rate before MTM |
30.2% |
30.3% |
29.5% |
28.2% |
The increase in normalized ETR excluding mark-to-market gains and losses linked to the hedging of our share-based payment programs in 2Q22 compared to 2Q21 and the decrease in HY22 compared to HY21 is driven by country mix.
|
Figure 10. Normalized Profit attributable to equity holders of AB InBev (million USD) |
||||||||
|
2Q21 |
2Q22 |
HY21 |
HY22 |
|||||
|
Profit attributable to equity holders of AB InBev |
1 862 |
1 597 |
2 458 |
1 692 |
||||
|
Net impact of non-underlying items on profit |
50 |
-78 |
466 |
1 168 |
||||
|
Normalized profit attributable to equity holders of AB InBev |
1 911 |
1 519 |
2 924 |
2 860 |
||||
|
Underlying profit attributable to equity holders of AB InBev |
1 507 |
1 468 |
2 606 |
2 672 |
Both normalized and underlying profit attributable to equity holders in 2Q21 and HY21 were positively impacted by 123 million USD, and in 2Q22 and HY22 by 115 million USD and 152 million USD respectively, after tax and non-controlling interest related to tax credits in Brazil.
Basic, normalized and underlying EPS
|
Figure 11. Earnings per share (USD) |
||||||||
|
2Q21 |
2Q22 |
HY21 |
HY22 |
|||||
|
Basic earnings per share |
0.93 |
0.79 |
1.23 |
0.84 |
||||
|
Net impact of non-underlying items on profit |
0.02 |
-0.05 |
0.24 |
0.58 |
||||
|
Normalized earnings per share |
0.95 |
0.75 |
1.46 |
1.42 |
||||
|
Underlying earnings per share |
0.75 |
0.73 |
1.30 |
1.33 |
||||
|
Weighted average number of ordinary and restricted shares (million) |
2 004 |
2 012 |
2 004 |
2 012 |
Normalized EPS in 2Q22 and 2Q21 included a mark-to-market gain on the hedging of our share-based payment programs of 0.02 USD and 0.22 USD respectively. Normalized EPS in HY22 and HY21 included a mark-to-market gain on the hedging of our share-based payment programs of 0.08 USD and 0.17 USD respectively.
|
Figure 12. Key components - Normalized Earnings per share in USD |
||||||||
|
2Q21 |
2Q22 |
HY21 |
HY22 |
|||||
|
Normalized EBIT before hyperinflation |
1.82 |
1.90 |
3.39 |
3.55 |
||||
|
Hyperinflation impacts in normalized EBIT |
- |
-0.01 |
-0.01 |
-0.02 |
||||
|
Normalized EBIT |
1.82 |
1.90 |
3.38 |
3.53 |
||||
|
Mark-to-market (share-based payment programs) |
0.22 |
0.02 |
0.17 |
0.08 |
||||
|
Net finance cost |
-0.60 |
-0.62 |
-1.20 |
-1.21 |
||||
|
Income tax expense |
-0.37 |
-0.39 |
-0.64 |
-0.65 |
||||
|
Associates & non-controlling interest |
-0.13 |
-0.15 |
-0.26 |
-0.32 |
||||
|
Normalized EPS |
0.95 |
0.75 |
1.46 |
1.42 |
||||
|
Mark-to-market (share-based payment programs) |
-0.22 |
-0.02 |
-0.17 |
-0.08 |
||||
|
Hyperinflation impacts in EPS |
0.02 |
-0.01 |
0.02 |
-0.01 |
||||
|
Underlying EPS |
0.75 |
0.73 |
1.30 |
1.33 |
||||
|
Weighted average number of ordinary and restricted shares (million) |
2 004 |
2 012 |
2 004 |
2 012 |
Reconciliation between profit attributable to equity holders and normalized EBITDA
|
Figure 13. Reconciliation of normalized EBITDA to profit attributable to equity holders of AB InBev (million USD) |
||||||||
|
2Q21 |
2Q22 |
HY21 |
HY22 |
|||||
|
Profit attributable to equity holders of AB InBev |
1 862 |
1 597 |
2 458 |
1 692 |
||||
|
Non-controlling interests |
319 |
378 |
616 |
782 |
||||
|
Profit |
2 182 |
1 975 |
3 074 |
2 474 |
||||
|
Income tax expense |
702 |
721 |
1 231 |
1 244 |
||||
|
Share of result of associates |
-69 |
-74 |
-100 |
-129 |
||||
|
Non-underlying share of results of associates |
- |
- |
- |
1 143 |
||||
|
Net finance (income)/cost |
755 |
1 217 |
2 047 |
2 282 |
||||
|
Non-underlying net finance (income)/cost |
-64 |
-36 |
299 |
-14 |
||||
|
Non-underlying items above EBIT |
150 |
9 |
217 |
105 |
||||
|
Normalized EBIT |
3 655 |
3 811 |
6 768 |
7 105 |
||||
|
Depreciation, amortization and impairment |
1 191 |
1 286 |
2 345 |
2 477 |
||||
|
Normalized EBITDA |
4 846 |
5 096 |
9 114 |
9 583 |
Normalized EBITDA and normalized EBIT are measures utilized by AB InBev to demonstrate the company’s underlying performance.
Normalized EBITDA is calculated excluding the following effects from profit attributable to equity holders of AB InBev: (i) non-controlling interest; (ii) income tax expense; (iii) share of results of associates; (iv) non-underlying share of results of associates; (v) net finance cost; (vi) non-underlying net finance cost; (vii) non-underlying items above EBIT; and (viii) depreciation, amortization and impairment.
Normalized EBITDA and normalized EBIT are not accounting measures under IFRS accounting and should not be considered as an alternative to profit attributable to equity holders as a measure of operational performance, or an alternative to cash flow as a measure of liquidity. Normalized EBITDA and normalized EBIT do not have a standard calculation method and AB InBev’s definition of normalized EBITDA and normalized EBIT may not be comparable to that of other companies.
Financial position
|
Figure 14. Cash Flow Statement (million USD) |
||||
|
HY21 |
HY22 |
|||
|
Operating activities |
||||
|
Profit of the period |
3 074 |
2 474 |
||
|
Interest, taxes and non-cash items included in profit |
6 062 |
7 015 |
||
|
Cash flow from operating activities before changes in working capital and use of provisions |
9 134 |
9 489 |
||
|
|
||||
|
Change in working capital |
-1 327 |
-3 339 |
||
|
Pension contributions and use of provisions |
-258 |
-195 |
||
|
Interest and taxes (paid)/received |
-3 696 |
-3 823 |
||
|
Dividends received |
86 |
50 |
||
|
Cash flow from operating activities |
3 939 |
2 182 |
||
|
|
||||
|
Investing activities |
||||
|
Net capex |
-2 104 |
-1 939 |
||
|
Acquisition and sale of subsidiaries, net of cash acquired/disposed of |
-203 |
-44 |
||
|
Net proceeds from sale/(acquisition) of other assets |
98 |
66 |
||
|
Cash flow from investing activities |
-2 209 |
-1 917 |
||
|
|
||||
|
Financing activities |
||||
|
Dividends paid |
-1 382 |
-1 276 |
||
|
Net (payments on)/proceeds from borrowings |
-7 999 |
-3 452 |
||
|
Payment of lease liabilities |
-256 |
-286 |
||
|
Sale/(purchase) of non-controlling interests and other |
-470 |
-378 |
||
|
Cash flow from financing activities |
-10 107 |
-5 392 |
||
|
Net increase/(decrease) in cash and cash equivalents |
-8 377 |
-5 128 |
HY22 recorded a decrease in cash and cash equivalents of 5 128 million USD compared to a decrease of 8 377 million USD in HY21, with the following movements:
Our net debt decreased to 75.9 billion USD as of 30 June 2022 from 76.2 billion USD as of 31 December 2021.
Our net debt to normalized EBITDA ratio was 3.86x as of 30 June 2022. Our optimal capital structure is a net debt to normalized EBITDA ratio of around 2x.
We continue to proactively manage our debt portfolio. After redemptions in January 2022, 94% of our bond portfolio holds a fixed-interest rate, 44% is denominated in currencies other than USD and maturities are well-distributed across the next several years.
In addition to a very comfortable debt maturity profile and strong cash flow generation, as of 30 June 2022, we had total liquidity of 17.0 billion USD, which consisted of 10.1 billion USD available under committed long-term credit facilities and 6.9 billion USD of cash, cash equivalents and short-term investments in debt securities less bank overdrafts.
Figure 15. Terms and debt repayment schedule as of 30 June 2022 (billion USD)
Notes
To facilitate the understanding of AB InBev’s underlying performance, the analyses of growth, including all comments in this press release, unless otherwise indicated, are based on organic growth and normalized numbers. In other words, financials are analyzed eliminating the impact of changes in currencies on translation of foreign operations, and scope changes. Scope changes represent the impact of acquisitions and divestitures, the start or termination of activities or the transfer of activities between segments, curtailment gains and losses and year over year changes in accounting estimates and other assumptions that management does not consider as part of the underlying performance of the business. All references per hectoliter (per hl) exclude US non-beer activities. References to the High End Company refer to a business unit made up of a portfolio of global, specialty and craft brands across more than 30 countries. Whenever presented in this document, all performance measures (EBITDA, EBIT, profit, tax rate, EPS) are presented on a “normalized” basis, which means they are presented before non-underlying items. Non-underlying items are either income or expenses which do not occur regularly as part of the normal activities of the Company. They are presented separately because they are important for the understanding of the underlying sustainable performance of the Company due to their size or nature. Normalized measures are additional measures used by management and should not replace the measures determined in accordance with IFRS as an indicator of the Company’s performance. We are reporting the results from Argentina applying hyperinflation accounting, starting from the 3Q18 results release in which we accounted for the hyperinflation impact for the first nine months of 2018. The IFRS rules (IAS 29) require us to restate the year-to-date results for the change in the general purchasing power of the local currency, using official indices before converting the local amounts at the closing rate of the period. These impacts are excluded from organic calculations and are identified separately in the annexes within the column labeled “Hyperinflation restatement”. In HY22, we reported a negative impact on the profit attributable to equity holders of AB InBev of 26 million USD. The impact in HY22 normalized EPS was -0.01 USD. Values in the figures and annexes may not add up, due to rounding. 2Q22 and HY22 EPS is based upon a weighted average of 2 012 million shares compared to a weighted average of 2 004 million shares for 2Q21 and HY21.
Legal disclaimer
This release contains “forward-looking statements”. These statements are based on the current expectations and views of future events and developments of the management of AB InBev and are naturally subject to uncertainty and changes in circumstances. The forward-looking statements contained in this release include statements other than historical facts and include statements typically containing words such as “will”, “may”, “should”, “believe”, “intends”, “expects”, “anticipates”, “targets”, “estimates”, “likely”, “foresees” and words of similar import. All statements other than statements of historical facts are forward-looking statements. You should not place undue reliance on these forward-looking statements, which reflect the current views of the management of AB InBev, are subject to numerous risks and uncertainties about AB InBev and are dependent on many factors, some of which are outside of AB InBev’s control. There are important factors, risks and uncertainties that could cause actual outcomes and results to be materially different, including, but not limited to, the effects of the COVID-19 pandemic and uncertainties about its impact and duration and the risks and uncertainties relating to AB InBev described under Item 3.D of AB InBev’s Annual Report on Form 20-F filed with the SEC on 18 March 2022. Many of these risks and uncertainties are, and will be, exacerbated by the COVID-19 pandemic and the ongoing conflict in Russia and Ukraine and any worsening of the global business and economic environment as a result. Other unknown or unpredictable factors could cause actual results to differ materially from those in the forward-looking statements. The forward-looking statements should be read in conjunction with the other cautionary statements that are included elsewhere, including AB InBev’s most recent Form 20-F and other reports furnished on Form 6-K, and any other documents that AB InBev has made public. Any forward-looking statements made in this communication are qualified in their entirety by these cautionary statements and there can be no assurance that the actual results or developments anticipated by AB InBev will be realized or, even if substantially realized, that they will have the expected consequences to, or effects on, AB InBev or its business or operations. Except as required by law, AB InBev undertakes no obligation to publicly update or revise any forward-looking statements, whether as a result of new information, future events or otherwise. The second quarter 2022 (2Q22) and half year 2022 (HY22) financial data set out in Figure 1 (except for the volume information), Figures 3 to 5, 7, 9, 10 and 13 and 14 of this press release have been extracted from the group’s unaudited condensed consolidated interim financial statements as of and for the six months ended 30 June 2022, which have been reviewed by our statutory auditors PwC Réviseurs d’Entreprises SRL / PwC Bedrijfsrevisoren BV in accordance with the standards of the Public Company Accounting Oversight Board (United States). Financial data included in Figures 6, 8 11, 12 and 15 have been extracted from the underlying accounting records as of and for the six months ended 30 June 2022 (except for the volume information). References in this document to materials on our websites, such as www.bees.com, are included as an aid to their location and are not incorporated by reference into this document.
Conference call and webcast
Investor Conference call and webcast on Thursday, 28 July 2022:
3.00pm Brussels / 2.00pm London / 9.00am New York
Registration details:
Webcast (listen-only mode):
AB InBev 2Q & HY22 Results Webcast
To join by phone, please use one of the following two phone numbers:
Toll-Free: 877-407-8029
Toll: 201-689-8029
About Anheuser-Busch InBev
Anheuser-Busch InBev is a publicly traded company (Euronext: ABI) based in Leuven, Belgium, with secondary listings on the Mexico (MEXBOL: ANB) and South Africa (JSE: ANH) stock exchanges and with American Depositary Receipts on the New York Stock Exchange (NYSE: BUD). As a company, we dream big to create a future with more cheers. We are always looking to serve up new ways to meet life’s moments, move our industry forward and make a meaningful impact in the world. We are committed to building great brands that stand the test of time and to brewing the best beers using the finest ingredients. Our diverse portfolio of well over 500 beer brands includes global brands Budweiser®, Corona® and Stella Artois®; multi-country brands Beck’s®, Hoegaarden®, Leffe® and Michelob ULTRA®; and local champions such as Aguila®, Antarctica®, Bud Light®, Brahma®, Cass®, Castle®, Castle Lite®, Cristal®, Harbin®, Jupiler®, Modelo Especial®, Quilmes®, Victoria®, Sedrin®, and Skol®. Our brewing heritage dates back more than 600 years, spanning continents and generations. From our European roots at the Den Hoorn brewery in Leuven, Belgium. To the pioneering spirit of the Anheuser & Co brewery in St. Louis, US. To the creation of the Castle Brewery in South Africa during the Johannesburg gold rush. To Bohemia, the first brewery in Brazil. Geographically diversified with a balanced exposure to developed and developing markets, we leverage the collective strengths of approximately 169,000 colleagues based in nearly 50 countries worldwide. For 2021, AB InBev’s reported revenue was 54.3 billion USD (excluding JVs and associates).
Annex 1
|
AB InBev Worldwide |
2Q21 |
Scope |
Currency |
Hyperinflation |
Organic |
2Q22 |
Organic |
|||||||
|
Total volumes (thousand hls) |
144 845 |
- |
- |
- |
4 885 |
149 729 |
3.4% |
|||||||
|
of which AB InBev own beer |
128 625 |
-914 |
- |
- |
3 395 |
131 107 |
2.7% |
|||||||
|
Revenue |
13 539 |
-126 |
-210 |
72 |
1 517 |
14 793 |
11.3% |
|||||||
|
Cost of sales |
-5 720 |
1 |
91 |
-31 |
-1 138 |
-6 796 |
-19.9% |
|||||||
|
Gross profit |
7 819 |
-124 |
-118 |
41 |
380 |
7 997 |
4.9% |
|||||||
|
SG&A |
-4 511 |
117 |
89 |
-17 |
-179 |
-4 500 |
-4.1% |
|||||||
|
Other operating income/(expenses) |
347 |
-38 |
6 |
-5 |
4 |
314 |
3.4% |
|||||||
|
Normalized EBIT |
3 655 |
-46 |
-23 |
20 |
204 |
3 811 |
6.0% |
|||||||
|
Normalized EBITDA |
4 846 |
-52 |
-52 |
21 |
333 |
5 096 |
7.2% |
|||||||
|
Normalized EBITDA margin |
35.8% |
|
|
|
|
34.5% |
-127 bps |
|||||||
|
|
|
|
|
|
|
|
|
|||||||
|
North America |
2Q21 |
Scope |
Currency |
Hyperinflation |
Organic |
2Q22 |
Organic |
|||||||
|
Total volumes (thousand hls) |
28 115 |
- |
- |
- |
-754 |
27 361 |
-2.7% |
|||||||
|
Revenue |
4 289 |
- |
-17 |
- |
118 |
4 390 |
2.7% |
|||||||
|
Cost of sales |
-1 628 |
-3 |
6 |
- |
-161 |
-1 785 |
-9.9% |
|||||||
|
Gross profit |
2 661 |
-3 |
-11 |
- |
-43 |
2 604 |
-1.6% |
|||||||
|
SG&A |
-1 257 |
-1 |
7 |
- |
42 |
-1 209 |
3.4% |
|||||||
|
Other operating income/(expenses) |
9 |
3 |
- |
- |
-4 |
7 |
-38.0% |
|||||||
|
Normalized EBIT |
1 413 |
-1 |
-4 |
- |
-5 |
1 402 |
-0.4% |
|||||||
|
Normalized EBITDA |
1 611 |
- |
-6 |
- |
-9 |
1 597 |
-0.6% |
|||||||
|
Normalized EBITDA margin |
37.6% |
|
|
|
|
36.4% |
-121 bps |
|||||||
|
|
|
|
|
|
|
|
|
|||||||
|
Middle Americas |
2Q21 |
Scope |
Currency |
Hyperinflation |
Organic |
2Q22 |
Organic |
|||||||
|
Total volumes (thousand hls) |
34 916 |
13 |
- |
- |
2 847 |
37 775 |
8.2% |
|||||||
|
Revenue |
3 053 |
-13 |
-4 |
- |
558 |
3 594 |
18.4% |
|||||||
|
Cost of sales |
-1 074 |
4 |
2 |
- |
-368 |
-1 435 |
-34.4% |
|||||||
|
Gross profit |
1 979 |
-8 |
-1 |
- |
190 |
2 159 |
9.6% |
|||||||
|
SG&A |
-809 |
6 |
2 |
- |
-74 |
-874 |
-9.2% |
|||||||
|
Other operating income/(expenses) |
1 |
- |
2 |
- |
-17 |
-14 |
- |
|||||||
|
Normalized EBIT |
1 171 |
-3 |
3 |
- |
100 |
1 271 |
8.5% |
|||||||
|
Normalized EBITDA |
1 454 |
-2 |
3 |
- |
155 |
1 610 |
10.7% |
|||||||
|
Normalized EBITDA margin |
47.6% |
|
|
|
|
44.8% |
-311 bps |
|||||||
|
|
|
|
|
|
|
|
|
|||||||
|
South America |
2Q21 |
Scope |
Currency |
Hyperinflation |
Organic |
2Q22 |
Organic |
|||||||
|
Total volumes (thousand hls) |
33 465 |
80 |
- |
- |
2 876 |
36 421 |
8.6% |
|||||||
|
Revenue |
1 898 |
26 |
59 |
72 |
570 |
2 626 |
30.2% |
|||||||
|
Cost of sales |
-1 013 |
-6 |
-43 |
-31 |
-326 |
-1 419 |
-32.4% |
|||||||
|
Gross profit |
885 |
20 |
16 |
41 |
245 |
1 207 |
27.7% |
|||||||
|
SG&A |
-638 |
-33 |
-22 |
-17 |
-145 |
-855 |
-21.8% |
|||||||
|
Other operating income/(expenses) |
254 |
-42 |
6 |
-5 |
30 |
243 |
91.9% |
|||||||
|
Normalized EBIT |
501 |
-54 |
- |
20 |
129 |
595 |
51.0% |
|||||||
|
Normalized EBITDA |
684 |
-54 |
5 |
21 |
165 |
820 |
37.9% |
|||||||
|
Normalized EBITDA margin |
36.0% |
|
|
|
|
31.2% |
132 bps |
|
EMEA |
2Q21 |
Scope |
Currency |
Hyperinflation |
Organic |
2Q22 |
Organic |
|||||||
|
Total volumes (thousand hls) |
22 875 |
22 |
- |
- |
-59 |
22 838 |
-0.3% |
|||||||
|
Revenue |
2 196 |
-71 |
-168 |
- |
184 |
2 140 |
8.7% |
|||||||
|
Cost of sales |
-1 007 |
-3 |
85 |
- |
-162 |
-1 087 |
-16.0% |
|||||||
|
Gross profit |
1 188 |
-74 |
-83 |
- |
22 |
1 054 |
2.0% |
|||||||
|
SG&A |
-838 |
74 |
62 |
- |
21 |
-680 |
2.8% |
|||||||
|
Other operating income/(expenses) |
44 |
1 |
-4 |
- |
8 |
49 |
18.7% |
|||||||
|
Normalized EBIT |
395 |
1 |
-24 |
- |
52 |
423 |
13.1% |
|||||||
|
Normalized EBITDA |
658 |
-7 |
-45 |
- |
87 |
692 |
13.3% |
|||||||
|
Normalized EBITDA margin |
29.9% |
|
|
|
|
32.3% |
132 bps |
|||||||
|
|
|
|
|
|
|
|
|
|||||||
|
Asia Pacific |
2Q21 |
Scope |
Currency |
Hyperinflation |
Organic |
2Q22 |
Organic |
|||||||
|
Total volumes (thousand hls) |
25 205 |
1 |
- |
- |
-109 |
25 097 |
-0.4% |
|||||||
|
Revenue |
1 864 |
-29 |
-70 |
- |
69 |
1 835 |
3.7% |
|||||||
|
Cost of sales |
-810 |
- |
31 |
- |
-101 |
-881 |
-12.5% |
|||||||
|
Gross profit |
1 055 |
-29 |
-39 |
- |
-32 |
954 |
-3.2% |
|||||||
|
SG&A |
-591 |
28 |
22 |
- |
10 |
-531 |
1.8% |
|||||||
|
Other operating income/(expenses) |
35 |
- |
- |
- |
-8 |
26 |
-23.4% |
|||||||
|
Normalized EBIT |
498 |
-1 |
-18 |
- |
-30 |
449 |
-6.1% |
|||||||
|
Normalized EBITDA |
672 |
-1 |
-23 |
- |
-27 |
620 |
-4.0% |
|||||||
|
Normalized EBITDA margin |
36.0% |
|
|
|
|
33.8% |
-274 bps |
|||||||
|
|
|
|
|
|
|
|
|
|||||||
|
Global Export and Holding Companies |
2Q21 |
Scope |
Currency |
Hyperinflation |
Organic |
2Q22 |
Organic |
|||||||
|
Total volumes (thousand hls) |
269 |
-116 |
- |
- |
85 |
238 |
55.7% |
|||||||
|
Revenue |
238 |
-39 |
-10 |
- |
19 |
208 |
9.3% |
|||||||
|
Cost of sales |
-187 |
9 |
10 |
- |
-20 |
-189 |
-11.3% |
|||||||
|
Gross profit |
51 |
-31 |
- |
- |
-2 |
19 |
-7.8% |
|||||||
|
SG&A |
-377 |
43 |
18 |
- |
-34 |
-350 |
-10.4% |
|||||||
|
Other operating income/(expenses) |
4 |
- |
3 |
- |
-5 |
2 |
- |
|||||||
|
Normalized EBIT |
-322 |
12 |
21 |
- |
-41 |
-330 |
-13.4% |
|||||||
|
Normalized EBITDA |
-232 |
13 |
14 |
- |
-37 |
-242 |
-17.3% |
Annex 2
|
AB InBev Worldwide |
HY21 |
Scope |
Currency |
Organic |
HY22 |
Organic |
||||||
|
Total volumes (thousand hls) |
280 398 |
- |
- |
8 676 |
289 074 |
3.1% |
||||||
|
of which AB InBev own beer |
247 635 |
-1 892 |
- |
5 949 |
251 692 |
2.4% |
||||||
|
Revenue |
25 832 |
-229 |
-514 |
2 938 |
28 027 |
11.5% |
||||||
|
Cost of sales |
-10 963 |
3 |
224 |
-2 049 |
-12 784 |
-18.7% |
||||||
|
Gross profit |
14 869 |
-225 |
-290 |
889 |
15 243 |
6.1% |
||||||
|
SG&A |
-8 571 |
213 |
188 |
-447 |
-8 616 |
-5.3% |
||||||
|
Other operating income/(expenses) |
470 |
-18 |
3 |
24 |
478 |
9.3% |
||||||
|
Normalized EBIT |
6 768 |
-30 |
-99 |
466 |
7 105 |
7.1% |
||||||
|
Normalized EBITDA |
9 114 |
-44 |
-156 |
670 |
9 583 |
7.5% |
||||||
|
Normalized EBITDA margin |
35.3% |
|
|
|
34.2% |
-122 bps |
||||||
|
|
|
|
|
|
|
|
||||||
|
North America |
HY21 |
Scope |
Currency |
Organic |
HY22 |
Organic |
||||||
|
Total volumes (thousand hls) |
53 252 |
- |
- |
-1 804 |
51 448 |
-3.4% |
||||||
|
Revenue |
8 040 |
- |
-18 |
170 |
8 192 |
2.1% |
||||||
|
Cost of sales |
-3 080 |
-5 |
6 |
-270 |
-3 349 |
-8.8% |
||||||
|
Gross profit |
4 960 |
-5 |
-11 |
-100 |
4 844 |
-2.0% |
||||||
|
SG&A |
-2 350 |
-2 |
7 |
66 |
-2 279 |
2.8% |
||||||
|
Other operating income/(expenses) |
15 |
6 |
- |
7 |
28 |
34.5% |
||||||
|
Normalized EBIT |
2 625 |
-1 |
-4 |
-27 |
2 592 |
-1.0% |
||||||
|
Normalized EBITDA |
3 014 |
- |
-6 |
-33 |
2 975 |
-1.1% |
||||||
|
Normalized EBITDA margin |
37.5% |
|
|
|
36.3% |
-118 bps |
||||||
|
|
|
|
|
|
|
|||||||
|
Middle Americas |
HY21 |
Scope |
Currency |
Organic |
HY22 |
Organic |
||||||
|
Total volumes (thousand hls) |
67 980 |
22 |
- |
4 022 |
72 024 |
5.9% |
||||||
|
Revenue |
5 893 |
-27 |
-107 |
934 |
6 693 |
15.9% |
||||||
|
Cost of sales |
-2 055 |
9 |
39 |
-619 |
-2 625 |
-30.3% |
||||||
|
Gross profit |
3 838 |
-18 |
-68 |
315 |
4 068 |
8.2% |
||||||
|
SG&A |
-1 577 |
15 |
26 |
-95 |
-1 631 |
-6.1% |
||||||
|
Other operating income/(expenses) |
5 |
- |
2 |
-18 |
-12 |
- |
||||||
|
Normalized EBIT |
2 266 |
-3 |
-40 |
202 |
2 425 |
8.9% |
||||||
|
Normalized EBITDA |
2 824 |
-3 |
-48 |
286 |
3 060 |
10.1% |
||||||
|
Normalized EBITDA margin |
47.9% |
|
|
|
45.7% |
-239 bps |
||||||
|
|
|
|
|
|
|
|
||||||
|
South America |
HY21 |
Scope |
Currency |
Organic |
HY22 |
Organic |
||||||
|
Total volumes (thousand hls) |
71 929 |
151 |
- |
4 735 |
76 815 |
6.6% |
||||||
|
Revenue |
4 146 |
52 |
-65 |
1 200 |
5 333 |
28.6% |
||||||
|
Cost of sales |
-2 091 |
-12 |
17 |
-706 |
-2 792 |
-33.6% |
||||||
|
Gross profit |
2 055 |
40 |
-49 |
494 |
2 541 |
23.6% |
||||||
|
SG&A |
-1 254 |
-60 |
7 |
-302 |
-1 609 |
-22.9% |
||||||
|
Other operating income/(expenses) |
287 |
-25 |
5 |
45 |
312 |
72.4% |
||||||
|
Normalized EBIT |
1 088 |
-45 |
-37 |
237 |
1 244 |
28.2% |
||||||
|
Normalized EBITDA |
1 447 |
-45 |
-39 |
302 |
1 666 |
25.1% |
||||||
|
Normalized EBITDA margin |
34.9% |
|
|
|
31.2% |
-77 bps |
|
EMEA |
HY21 |
Scope |
Currency |
Organic |
HY22 |
Organic |
||||||
|
Total volumes (thousand hls) |
40 540 |
29 |
- |
2 392 |
42 962 |
5.9% |
||||||
|
Revenue |
3 763 |
-125 |
-246 |
549 |
3 940 |
15.1% |
||||||
|
Cost of sales |
-1 796 |
-5 |
124 |
-323 |
-2 000 |
-17.9% |
||||||
|
Gross profit |
1 966 |
-130 |
-123 |
226 |
1 939 |
12.3% |
||||||
|
SG&A |
-1 496 |
128 |
97 |
-70 |
-1 341 |
-5.1% |
||||||
|
Other operating income/(expenses) |
92 |
1 |
-6 |
- |
88 |
0.4% |
||||||
|
Normalized EBIT |
563 |
-1 |
-32 |
156 |
685 |
27.8% |
||||||
|
Normalized EBITDA |
1 060 |
-17 |
-65 |
214 |
1 192 |
20.5% |
||||||
|
Normalized EBITDA margin |
28.2% |
|
|
|
30.3% |
134 bps |
||||||
|
|
|
|
|
|
|
|
||||||
|
Asia Pacific |
HY21 |
Scope |
Currency |
Organic |
HY22 |
Organic |
||||||
|
Total volumes (thousand hls) |
46 081 |
1 |
- |
-698 |
45 385 |
-1.5% |
||||||
|
Revenue |
3 500 |
-54 |
-63 |
88 |
3 471 |
2.6% |
||||||
|
Cost of sales |
-1 555 |
- |
27 |
-126 |
-1 655 |
-8.1% |
||||||
|
Gross profit |
1 944 |
-55 |
-36 |
-38 |
1 816 |
-2.0% |
||||||
|
SG&A |
-1 126 |
53 |
22 |
52 |
-999 |
4.8% |
||||||
|
Other operating income/(expenses) |
64 |
- |
- |
3 |
67 |
5.1% |
||||||
|
Normalized EBIT |
882 |
-2 |
-14 |
17 |
884 |
1.9% |
||||||
|
Normalized EBITDA |
1 242 |
-2 |
-17 |
9 |
1 232 |
0.7% |
||||||
|
Normalized EBITDA margin |
35.5% |
|
|
|
35.5% |
-64 bps |
||||||
|
|
|
|
|
|
|
|
||||||
|
Global Export and Holding Companies |
HY21 |
Scope |
Currency |
Organic |
HY22 |
Organic |
||||||
|
Total volumes (thousand hls) |
615 |
-204 |
- |
29 |
440 |
6.9% |
||||||
|
Revenue |
491 |
-74 |
-15 |
-3 |
399 |
-0.8% |
||||||
|
Cost of sales |
-385 |
17 |
11 |
-4 |
-362 |
-1.2% |
||||||
|
Gross profit |
106 |
-58 |
-4 |
-8 |
36 |
-15.7% |
||||||
|
SG&A |
-769 |
80 |
31 |
-98 |
-756 |
-14.3% |
||||||
|
Other operating income/(expenses) |
7 |
- |
2 |
-14 |
-5 |
- |
||||||
|
Normalized EBIT |
-656 |
22 |
29 |
-120 |
-725 |
-19.1% |
||||||
|
Normalized EBITDA |
-473 |
23 |
18 |
-108 |
-541 |
-24.3% |
View source version on businesswire.com: https://www.businesswire.com/news/home/20220727006135/en/
![]()
Related Tags

![]() IIFL Customer Care Number
IIFL Customer Care Number
(Gold/NCD/NBFC/Insurance/NPS)
1860-267-3000 / 7039-050-000
![]() IIFL Securities Support WhatsApp Number
IIFL Securities Support WhatsApp Number
+91 9892691696
Download The App Now
Follow us on
2024, IIFL Securities Ltd. All Rights Reserved
www.indiainfoline.com is part of the IIFL Group, a leading financial services player and a diversified NBFC. The site provides comprehensive and real time information on Indian corporates, sectors, financial markets and economy. On the site we feature industry and political leaders, entrepreneurs, and trend setters. The research, personal finance and market tutorial sections are widely followed by students, academia, corporates and investors among others.
Stock Broker SEBI Regn. No: INZ000164132, PMS SEBI Regn. No: INP000002213,IA SEBI Regn. No: INA000000623, SEBI RA Regn. No: INH000000248

This Certificate Demonstrates That IIFL As An Organization Has Defined And Put In Place Best-Practice Information Security Processes.