Stock prices are highly volatile. Analysts constantly record the changes in stock prices and try to analyse the collected data points to predict the stock price movements. One such data point they refer to is ‘today’s low’. This blog post decodes today’s low meaning.
Today’s low definition indicates the lowest price at which a stock trades on that day. Today’s low and high are essential parameters for traders or technical analysts. Technical analysts aim to earn profits from a stock’s short-term price movements. Today’s low in trading provides an insight into a stock’s price, such as what factors it is sensitive to and what news drove the fall in price.
Today’s low is usually lower than the opening or closing price of the stock. It is unlikely but not impossible that the day’s lowest price would occur at the opening or closing session.
Today’s low and today’s high help traders predict stock prices. They can identify trading gaps or sudden spikes up or down in a stock’s price, which helps them gauge directional movement, price volatility, candlestick patterns and more. This enables them to determine a trade’s entry and exit points.
For example, if today’s low is INR 100 and the previous day’s high was INR 80, there would be a gap. The identification of a gap, along with other market signals enables technical analysts to trade particular stock
Data points in a typical stock quote include the open, close/ previous close, outstanding shares volume, the last traded price, today’s high and today’s low prices, among other things.
A figure recorded as the highest/ lowest price of a stock over the last 52 weeks is referred to as its 52-week high/ low. The 52-week figures give a more comprehensive view of a company’s stock performance.
While today’s low only tells about the lowest price for that DAY, a 52-week low indicates the stock’s lowest price for the previous 52 weeks.
On 9th June 2022, the shares of L&T opened on the Stock Exchanges at INR 1556.20 and closed at INR 1595.10. The intraday low (today’s low) was INR 1556.20, and the intraday high was INR 1600.
Technical analysts study these data points to discover a pattern or a gap and decide on the trades accordingly.
Today’s low represents the lowest value the stock price reached that day. On a line graph, today’s low will be the lowest point on it.
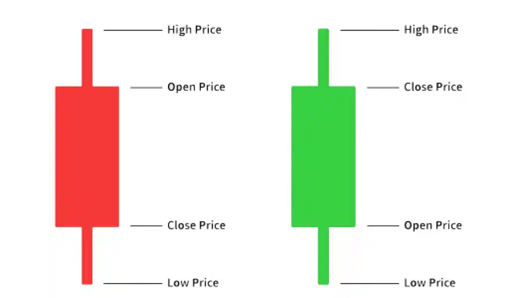
A candlestick indicates the stock’s open, high, low, and close price for the day. The wide part of the candlestick is called the body. The threads above and below it are called its wicks.
The lowest point of the lower wick represents that day’s low or today’s low.
Today’s high is the highest intraday price for a stock. On a line graph, it is represented by the highest point. On a candlestick, it is the highest point on the upper wick.
Ans: A 52-week high is the highest value a stock’s price has reached in the last 52 weeks or year.
Ans: The 52-week range implies the 52-week high and low values of stock and is used extensively by traders and investors for trading/ investment decisions.
![]() IIFL Customer Care Number
IIFL Customer Care Number
(Gold/NCD/NBFC/Insurance/NPS)
1860-267-3000 / 7039-050-000
![]() IIFL Capital Services Support WhatsApp Number
IIFL Capital Services Support WhatsApp Number
+91 9892691696
Download The App Now
Follow us on
2026, IIFL Capital Services Ltd. All Rights Reserved
IIFL Capital Services Limited - Stock Broker SEBI Regn. No: INZ000164132, PMS SEBI Regn. No: INP000002213,IA SEBI Regn. No: INA000000623, SEBI RA Regn. No: INH000000248, DP SEBI Reg. No. IN-DP-185-2016, BSE Enlistment Number (RA): 5016
ARN NO : 47791 (AMFI Registered Mutual Fund & Specialized Investment Fund Distributor), PFRDA Reg. No. PoP 20092018

This Certificate Demonstrates That IIFL As An Organization Has Defined And Put In Place Best-Practice Information Security Processes.