

FPI flows into Indian markets remained weak in the week ended 9 January 2026, as equity selling continued to outweigh limited support from other segments. Overall FPI outflows stood at INR 82.27 billion, which were slightly lower than the withdrawals seen in the previous week. Equity outflows were driven by secondary market selling, while primary market equity inflows of INR 0.29 billion provided only marginal support. Meanwhile, debt markets recorded near-flat inflows of INR 0.2 billion, with small amounts seen in hybrid instruments and mutual funds. Overall, foreign investor sentiment remained subdued.
FPI flows for the week ended 2026-01-09 INR -82.3 billion
FPI flows continued to be negative in the week ended 9 January 2026, with overall net outflows of INR 82.27 billion, extending the selling trend seen in recent weeks. The outflows were driven almost entirely by equity market selling, particularly in the secondary market. Equity assets recorded net outflows of INR 85.15 billion, led by secondary market sales of INR 85.44 billion, while primary market equity saw modest inflows of INR 0.29 billion. In contrast, debt markets witnessed marginal inflows of INR 0.22 billion, while hybrid instruments and mutual funds attracted inflows of INR 0.83 billion and INR 1.83 billion, respectively.
Figure: FPI/FII flows for the week ending 2026-01-09
| Asset Class | Net Investment (INR Billions) |
| Foreign_Investors | -82.27 |
| Foreign_Investors.Debt | 0.22 |
| Foreign_Investors.Equity | -85.15 |
| Foreign_Investors.Equity.Primary | 0.29 |
| Foreign_Investors.Equity.Secondary | -85.44 |
| Foreign_Investors.Mutual_Fund | 1.83 |
| Foreign_Investors.Hybrid | 0.83 |
| Foreign_Investors.AIF | 0.0 |
Source: NSDL
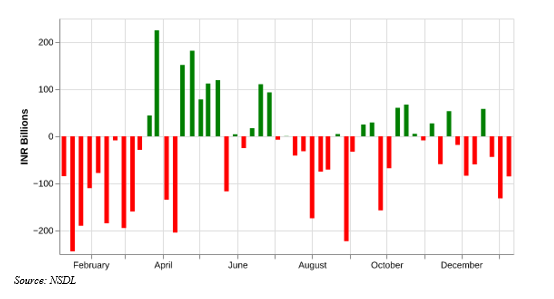
Figure: Recent history of FPI flows
| Week Ending | Net Investment (INR Billions) |
| 09 Jan, 2026 | -82.27 |
| 02 Jan, 2026 | -96.41 |
| 26 Dec, 2025 | -98.09 |
| 19 Dec, 2025 | 35.37 |
| 12 Dec, 2025 | -112.6 |
| 05 Dec, 2025 | -107.49 |
| 28 Nov, 2025 | -24.68 |
| 21 Nov, 2025 | 58.18 |
| 14 Nov, 2025 | 18.14 |
| 07 Nov, 2025 | 10.89 |
Source: NSDL
Figure: History of FPI flows
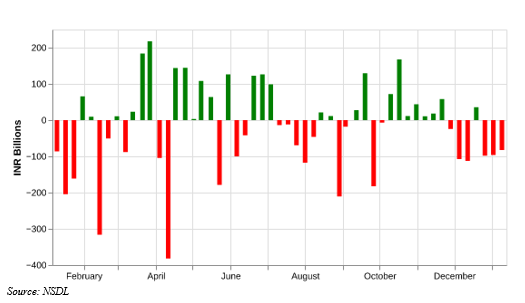
FPI flows in Equity for the week ended 2026-01-09 INR -85.1 billion
The week witnessed a continuation of FPI selling in secondary equity markets, while activity in primary equity remained subdued but marginally positive. Overall, equity recorded net outflows of INR 85.1 billion by FPIs, reversing the intermittent inflows seen in late December. Net outflows in secondary equity stood at INR 85.4 billion, while primary equity witnessed modest inflows of INR 0.3 billion.
Compared with the previous week, FPI equity outflows moderated but remained elevated. This persistent selling pressure suggests that FII sentiment remains cautious, largely influenced by global risk-off trends, interest rate volatility, and geopolitical concerns. Selling continued to be concentrated in the secondary market, while primary equity activity stayed limited and neutral. This indicates that flows were driven by existing investors trimming exposure rather than fresh equity issuance.
Figure: Recent history of FPI flows in equity
| Week Ending | FPI.Equity | FPI.Equity.Primary | FPI.Equity.Secondary |
| 09 Jan, 2026 | -85.1 | 0.3 | -85.4 |
| 02 Jan, 2026 | -131.7 | 1.3 | -132.9 |
| 26 Dec, 2025 | -43.9 | 5.4 | -49.3 |
| 19 Dec, 2025 | 58.0 | 49.7 | 8.3 |
| 12 Dec, 2025 | -59.8 | 37.4 | -97.2 |
| 05 Dec, 2025 | -83.5 | -17.3 | -66.2 |
| 28 Nov, 2025 | -18.5 | 4.8 | -23.3 |
| 21 Nov, 2025 | 53.5 | 36.7 | 16.8 |
| 14 Nov, 2025 | -59.2 | 41.9 | -101.1 |
| 07 Nov, 2025 | 27.6 | 35.8 | -8.2 |
Source: NSDL
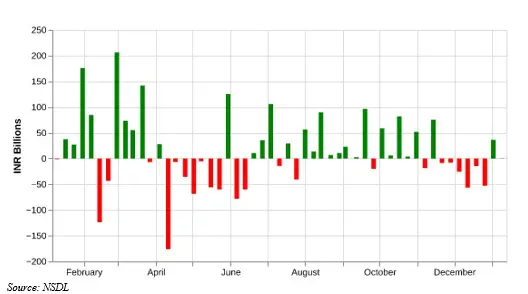
Figure: History of FPI flows in equity
FPI flows in Debt for the week ended 2026-01-09 INR 0.2 billion
The latest weekly data shows that FPIs recorded a marginal net inflow of INR 0.2 billion into the Indian debt market in the week ended 9 January 2026, marking a second consecutive week of purchases. This recent recovery follows a significant period of heavy selling throughout December, where investors consistently offloaded debt amid a broader reduction in emerging market exposure. The modest inflow likely reflects short-term portfolio rebalancing rather than a substantive shift in long-term demand, as investors digest mixed signals from rising global yields and the Indian central bank’s stance on interest rates.
The overall FII sentiment appears to be in a state of transition, as the market attempts to stabilize after a stretch of persistent outflows in late 2025. While the recent inflows suggest a renewed interest in locking in fixed-income returns, the sentiment remains fragile due to waning momentum from global bond index inclusions and external pressures from currency fluctuations. Despite the supportive stance of domestic monetary policy, the broader trend reflects a cautious approach as investors balance the benefits of high-yielding Indian bonds against heightened global uncertainty and portfolio rotation strategies.
Figure: Recent history of FPI flows in debt
| Week Ending | Net Investment (INR Billions) |
| 09 Jan, 2026 | 0.2 |
| 02 Jan, 2026 | 36.2 |
| 26 Dec, 2025 | -52.7 |
| 19 Dec, 2025 | -14.8 |
| 12 Dec, 2025 | -56.7 |
| 05 Dec, 2025 | -25.8 |
| 28 Nov, 2025 | -8.0 |
| 21 Nov, 2025 | -8.6 |
| 14 Nov, 2025 | 75.6 |
| 07 Nov, 2025 | -18.9 |
Source: NSDL
Figure: History of FPI flows in debt
Related Tags
![]() IIFL Customer Care Number
IIFL Customer Care Number
(Gold/NCD/NBFC/Insurance/NPS)
1860-267-3000 / 7039-050-000
![]() IIFL Capital Services Support WhatsApp Number
IIFL Capital Services Support WhatsApp Number
+91 9892691696
Download The App Now
Follow us on
2026, IIFL Capital Services Ltd. All Rights Reserved
IIFL Capital Services Limited - Stock Broker SEBI Regn. No: INZ000164132 (Member ID - NSE: 10975 BSE: 179 MCX: 55995 NCDEX: 01249), DP SEBI Reg. No. IN-DP-185-2016, IA SEBI Regn. No: INA000000623, Merchant Banker SEBI Regn. No. INM000010940, RA SEBI Regn. No: INH000000248, BSE Enlistment Number (RA): 5016, AMFI-Registered Mutual Fund Distributor & SIF Distributor
ARN NO : 47791 (Date of initial registration – 17/02/2007; Current validity of ARN – 08/02/2027), PFRDA Reg. No. PoP 20092018, IRDAI Corporate Agent (Composite) : CA1099

This Certificate Demonstrates That IIFL As An Organization Has Defined And Put In Place Best-Practice Information Security Processes.


