

FPI flows into Indian markets weakened sharply in the week ended 2 January 2026, as equity selling outweighed support from the debt segment. Overall FPI outflows stood at INR 96.4 billion, marking one of the steepest weekly withdrawals in recent weeks. Equity outflows were driven by secondary market selling, while modest primary market equity inflows provided only limited support. Meanwhile, debt markets and mutual funds saw net inflows. Overall, foreign investor sentiment remained subdued.
FPI flows for the week ended 2026-01-02: INR -96.4 billion
FPI flows turned sharply negative in the week ended 2 January 2026, with overall net outflows of INR 96.4 billion, reflecting one of the heaviest weekly outflows seen in recent weeks. The outflows were primarily driven by heavy equity selling. Equity assets recorded net outflows of INR 131.65 billion, driven almost entirely by secondary market sales of INR 132.94 billion, while primary market equity provided limited support with inflows of INR 1.29 billion. In contrast, debt markets saw net inflows of INR 33.18 billion. Among other smaller asset classes, hybrid instruments witnessed outflows of INR 1.01 billion while Mutual funds recorded small inflows of INR 0.12 billion.
Figure: FPI/FII flows for the week ending 2026-01-02
| Asset Class | Net Investment (INR Billions) |
| Foreign_Investors | -96.41 |
| Foreign_Investors.Debt | 36.18 |
| Foreign_Investors.Equity | -131.65 |
| Foreign_Investors.Equity.Primary | 1.29 |
| Foreign_Investors.Equity.Secondary | -132.94 |
| Foreign_Investors.Mutual_Fund | 0.12 |
| Foreign_Investors.Hybrid | -1.01 |
| Foreign_Investors.AIF | -0.05 |
Source: NSDL
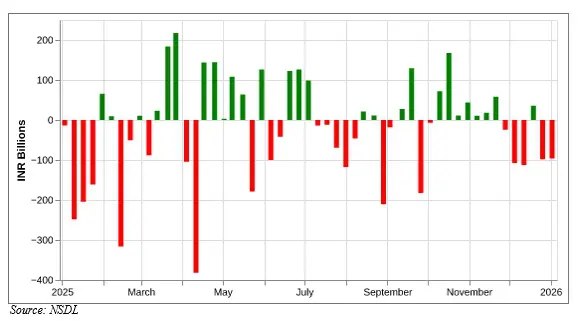
Figure: Recent history of FPI flows
| Week Ending | Net Investment (INR Billions) |
| 02 Jan, 2026 | -96.41 |
| 26 Dec, 2025 | -98.09 |
| 19 Dec, 2025 | 35.37 |
| 12 Dec, 2025 | -112.6 |
| 05 Dec, 2025 | -107.49 |
| 28 Nov, 2025 | -24.68 |
| 21 Nov, 2025 | 58.18 |
| 14 Nov, 2025 | 18.14 |
| 07 Nov, 2025 | 10.89 |
| 31 Oct, 2025 | 43.61 |
Source: NSDL
Figure: History of FPI flows
FPI flows in Equity for the week ended 2026-01-02: INR -131.7 billion
The first trading week of the new year witnessed a sharp escalation in FPI selling in secondary equity markets. Activity in primary equity remained subdued but marginally positive. Overall, equity recorded net outflows of INR 131.7 billion from FPIs. Net outflows in secondary equity stood at INR 132.9 billion, while primary equity witnessed modest inflows of INR 1.3 billion.
Compared with the previous week, equity outflows deepened sharply from INR 43.9 billion to INR 131.7 billion, driven by an intensification of secondary market selling. Profit booking, heightened risk aversion and country rotation were among the key reasons.
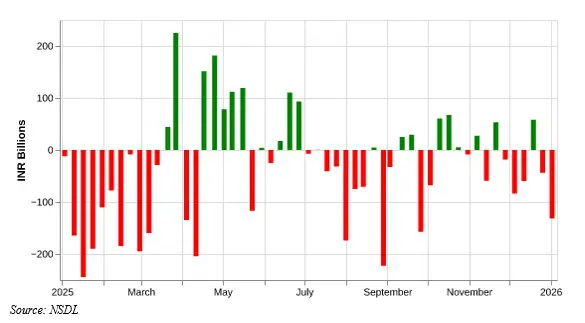
Figure: Recent history of FPI flows in equity
| Week Ending | FPI.Equity | FPI.Equity.Primary | FPI.Equity.Secondary |
| 02 Jan, 2026 | -131.7 | 1.3 | -132.9 |
| 26 Dec, 2025 | -43.9 | 5.4 | -49.3 |
| 19 Dec, 2025 | 58.0 | 49.7 | 8.3 |
| 12 Dec, 2025 | -59.8 | 37.4 | -97.2 |
| 05 Dec, 2025 | -83.5 | -17.3 | -66.2 |
| 28 Nov, 2025 | -18.5 | 4.8 | -23.3 |
| 21 Nov, 2025 | 53.5 | 36.7 | 16.8 |
| 14 Nov, 2025 | -59.2 | 41.9 | -101.1 |
| 07 Nov, 2025 | 27.6 | 35.8 | -8.2 |
| 31 Oct, 2025 | -8.7 | 0.3 | -9.0 |
Source: NSDL
Figure: History of FPI flows in equity
FPI flows in Debt for the week ended 2026-01-02: INR 36.2 billion
The latest weekly data shows that FPIs recorded net inflows of INR 36.2 billion into the Indian debt market in the week ended 2 January 2026, reversing the sustained outflows seen over the previous weeks. The inflow follows a prolonged phase of withdrawals after a strong inflow recorded earlier in the period. While the magnitude of the latest inflow remains modest compared with the earlier peak, it marks a turnaround from the recent trend of persistent debt outflows.
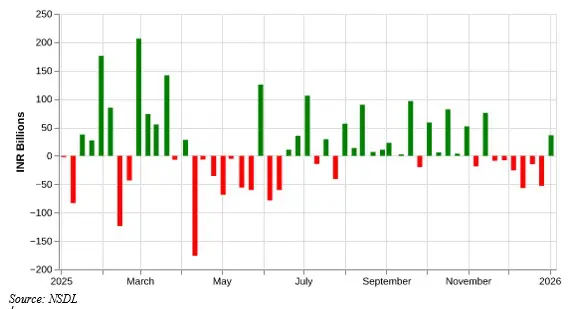
Figure: Recent history of FPI flows in debt
| Week Ending | Net Investment (INR Billions) |
| 02 Jan, 2026 | 36.2 |
| 26 Dec, 2025 | -52.7 |
| 19 Dec, 2025 | -14.8 |
| 12 Dec, 2025 | -56.7 |
| 05 Dec, 2025 | -25.8 |
| 28 Nov, 2025 | -8.0 |
| 21 Nov, 2025 | -8.6 |
| 14 Nov, 2025 | 75.6 |
| 07 Nov, 2025 | -18.9 |
| 31 Oct, 2025 | 52.0 |
Source: NSDL
Figure: History of FPI flows in debt
Related Tags
![]() IIFL Customer Care Number
IIFL Customer Care Number
(Gold/NCD/NBFC/Insurance/NPS)
1860-267-3000 / 7039-050-000
![]() IIFL Capital Services Support WhatsApp Number
IIFL Capital Services Support WhatsApp Number
+91 9892691696
Download The App Now
Follow us on
2026, IIFL Capital Services Ltd. All Rights Reserved
IIFL Capital Services Limited - Stock Broker SEBI Regn. No: INZ000164132 (Member ID - NSE: 10975 BSE: 179 MCX: 55995 NCDEX: 01249), DP SEBI Reg. No. IN-DP-185-2016, PMS SEBI Regn. No: INP000002213, IA SEBI Regn. No: INA000000623, Merchant Banker SEBI Regn. No. INM000010940, RA SEBI Regn. No: INH000000248, BSE Enlistment Number (RA): 5016, AMFI-Registered Mutual Fund Distributor & SIF Distributor
ARN NO : 47791 (Date of initial registration – 17/02/2007; Current validity of ARN – 08/02/2027), PFRDA Reg. No. PoP 20092018, IRDAI Corporate Agent (Composite) : CA1099

This Certificate Demonstrates That IIFL As An Organization Has Defined And Put In Place Best-Practice Information Security Processes.


