

FPI flows into Indian markets weakened last week, as both equity and debt segments recorded net outflows. Overall FPI outflows stood at INR 98.09 billion for the week ended 26 December 2025, reversing the previous week’s inflows. Equity outflows were driven by secondary market selling, with primary market equity inflows of INR 5.38 billion as the only positive. Debt markets also remained under pressure, along with marginal withdrawals from hybrid instruments and mutual funds. Overall, foreign investor appetite remained subdued.
FPI flows for the week ended 2025-12-26 INR -98.1 billion
FPI flows turned sharply negative in the week ended 26 December 2025, with overall net outflows of INR 98.09 billion, reversing net inflows of INR 35.37 billion in the previous week. The outflows were largely driven by debt and secondary equity selling. Equity assets recorded net outflows of INR 43.89 billion, driven by secondary market sales of INR 49.27 billion. In contrast, primary market equity recorded modest inflows of INR 5.38 billion. Debt markets also witnessed sizable outflows of INR 52.67 billion, while hybrid instruments and mutual funds saw marginal withdrawals of INR 1.05 billion and INR 0.47 billion, respectively.
Figure: FPI/FII flows for the week ending 2025-12-26
| Asset Class | Net Investment (INR Billions) |
| Foreign_Investors | -98.09 |
| Foreign_Investors.Debt | -52.67 |
| Foreign_Investors.Equity | -43.89 |
| Foreign_Investors.Equity.Primary | 5.38 |
| Foreign_Investors.Equity.Secondary | -49.27 |
| Foreign_Investors.Mutual_Fund | -0.47 |
| Foreign_Investors.Hybrid | -1.05 |
| Foreign_Investors.AIF | 0.0 |
Source: NSDL
Figure: Recent history of FPI flows
| Week Ending | Net Investment (INR Billions) |
| 26 Dec, 2025 | -98.09 |
| 19 Dec, 2025 | 35.37 |
| 12 Dec, 2025 | -112.6 |
| 05 Dec, 2025 | -107.49 |
| 28 Nov, 2025 | -24.68 |
| 21 Nov, 2025 | 58.18 |
| 14 Nov, 2025 | 18.14 |
| 07 Nov, 2025 | 10.89 |
| 31 Oct, 2025 | 43.61 |
| 24 Oct, 2025 | 11.51 |
Source: NSDL
Figure: History of FPI flows
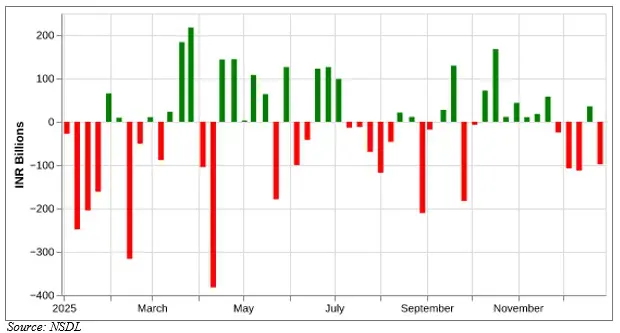
Source: NSDL
FPI flows in Equity for the week ended 2025-12-26 INR -43.9 billion
The Christmas week witnessed a resumption in FPI selling in secondary equity. Activity in primary equity was subdued but positive. Overall, equity witnessed net outflows of INR 43.9 billion from FPIs. This reversed the strong inflows seen during the previous week. Net outflow in secondary equity was INR 49.3 billion. Primary equity witnessed modest inflows of INR 5.4 billion.
Barring three weeks, FPI flows in secondary equity have been negative over the past 10 weeks. In comparison, a strong IPO market has offset some of the FPI selling pressure from the secondary market. The volatility in FPI flows continues to influence sentiment in Indian markets – especially in FPI-heavy sectors like IT and banking.
Figure: Recent history of FPI flows in equity
| Week Ending | FPI.Equity | FPI.Equity.Primary | FPI.Equity.Secondary |
| 26 Dec, 2025 | -43.9 | 5.4 | -49.3 |
| 19 Dec, 2025 | 58.0 | 49.7 | 8.3 |
| 12 Dec, 2025 | -59.8 | 37.4 | -97.2 |
| 05 Dec, 2025 | -83.5 | -17.3 | -66.2 |
| 28 Nov, 2025 | -18.5 | 4.8 | -23.3 |
| 21 Nov, 2025 | 53.5 | 36.7 | 16.8 |
| 14 Nov, 2025 | -59.2 | 41.9 | -101.1 |
| 07 Nov, 2025 | 27.6 | 35.8 | -8.2 |
| 31 Oct, 2025 | -8.7 | 0.3 | -9.0 |
| 24 Oct, 2025 | 5.3 | 1.0 | 4.4 |
Source: NSDL
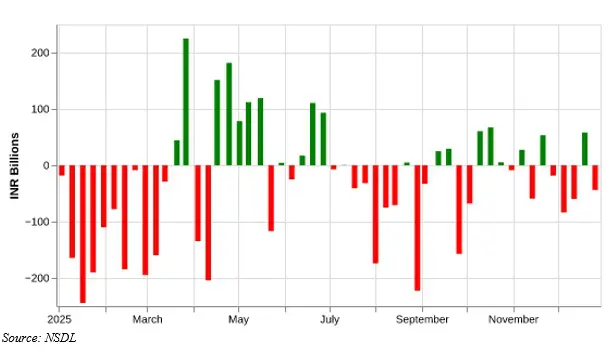
Figure: History of FPI flows in equity
FPI flows in Debt for the week ended 2025-12-26 INR -52.7 billion
The latest weekly data shows that FPIs withdrew INR 52.7 billion from the Indian debt market in the week ended 26 December 2025. The outflow was sharply higher than the INR 14.8 billion withdrawal recorded in the previous week. After being positive for much of 2H25, FPIs have started exiting Indian debt markets towards the end of the year. Falling interest rates and a depreciating INR have eroded the effective returns from Indian debt investments.
Figure: Recent history of FPI flows in debt
| Week Ending | Net Investment (INR Billions) |
| 26 Dec, 2025 | -52.7 |
| 19 Dec, 2025 | -14.8 |
| 12 Dec, 2025 | -56.7 |
| 05 Dec, 2025 | -25.8 |
| 28 Nov, 2025 | -8.0 |
| 21 Nov, 2025 | -8.6 |
| 14 Nov, 2025 | 75.6 |
| 07 Nov, 2025 | -18.9 |
| 31 Oct, 2025 | 52.0 |
| 24 Oct, 2025 | 3.6 |
Source: NSDL
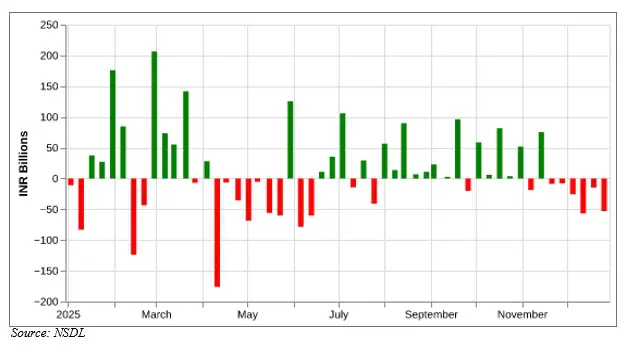
Figure: History of FPI flows in debt
Related Tags
![]() IIFL Customer Care Number
IIFL Customer Care Number
(Gold/NCD/NBFC/Insurance/NPS)
1860-267-3000 / 7039-050-000
![]() IIFL Capital Services Support WhatsApp Number
IIFL Capital Services Support WhatsApp Number
+91 9892691696
Download The App Now
Follow us on
2026, IIFL Capital Services Ltd. All Rights Reserved
IIFL Capital Services Limited - Stock Broker SEBI Regn. No: INZ000164132 (Member ID - NSE: 10975 BSE: 179 MCX: 55995 NCDEX: 01249), DP SEBI Reg. No. IN-DP-185-2016, IA SEBI Regn. No: INA000000623, Merchant Banker SEBI Regn. No. INM000010940, RA SEBI Regn. No: INH000000248, BSE Enlistment Number (RA): 5016, AMFI-Registered Mutual Fund Distributor & SIF Distributor
ARN NO : 47791 (Date of initial registration – 17/02/2007; Current validity of ARN – 08/02/2027), PFRDA Reg. No. PoP 20092018, IRDAI Corporate Agent (Composite) : CA1099

This Certificate Demonstrates That IIFL As An Organization Has Defined And Put In Place Best-Practice Information Security Processes.


