
Foreign portfolio investors remained net buyers during the week ended February 13, 2026, with total net inflows of INR 69.34 billion. Overall flows were supported mainly by strong debt purchases, indicating continued foreign interest in India’s fixed-income opportunities, while equity flows remained mixed.
Equity Markets: Equity inflows for the week stood at INR 19.42 billion. The primary market attracted the bulk of these investments at INR 23.96 billion, reflecting steady participation in new issuances. In contrast, the secondary market recorded a net outflow of INR 4.55 billion, suggesting some profit-taking in existing equities. Hybrid instruments also saw a mild withdrawal of around INR 2.0 billion, slightly moderating the overall equity-linked inflows.
Debt and Alternative Segments: Debt instruments accounted for the largest share of foreign investment, with INR 51.39 billion in net inflows — the strongest contributor for the week and a sign of improving sentiment toward Indian bonds. Mutual funds saw only marginal inflows of INR 0.54 billion, while alternative investment funds remained inactive with no net movement.
Table: Net Investment Data
|
Asset Class |
Net Investment (INR Billions) |
|
Foreign_Investors |
69.34 |
|
Foreign_Investors.Debt |
51.39 |
|
Foreign_Investors.Equity |
19.42 |
|
Foreign_Investors.Equity.Primary |
23.96 |
|
Foreign_Investors.Equity.Secondary |
-4.55 |
|
Foreign_Investors.Mutual_Fund |
0.54 |
|
Foreign_Investors.Hybrid |
-2.0 |
|
Foreign_Investors.AIF |
0.0 |
Source: NSDL
Table: Recent history of FPI flows
|
Week Ending |
Net Investment (INR Billions) |
|
13 Feb, 2026 |
69.34 |
|
06 Feb, 2026 |
132.47 |
|
30 Jan, 2026 |
60.76 |
|
23 Jan, 2026 |
-50.27 |
|
16 Jan, 2026 |
-143.06 |
|
09 Jan, 2026 |
-82.27 |
|
02 Jan, 2026 |
-96.41 |
|
26 Dec, 2025 |
-98.09 |
|
19 Dec, 2025 |
35.37 |
|
12 Dec, 2025 |
-112.6 |
Source: NSDL
Figure: History of FPI flows
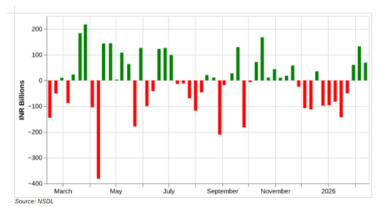
Source: NSDL
FPI flows in Equity
FPIs turned net buyers in Indian equities during the week ended February 13, 2026, with net inflows of INR 19.4 billion. The inflow was driven mainly by strong participation in the primary market, which recorded investments of about INR 24.0 billion, while the secondary market saw a modest outflow of INR 4.5 billion. Primary-market buying more than offset the secondary-market selling, keeping overall equity flows in positive territory despite a shift from the previous week’s strong secondary-market inflow.
While FPIs have been sellers in the secondary market for the majority of the past 10 weeks, the trend had reversed around the last week of January. Post budget, FPI inflows in the secondary market were the highest in recent times. However, sentiment towards technology sectors has worsened due to worries over AI. This has likely resulted in heavy FPI selling in India’s IT services, which has impacted overall flows.
Table: Recent history of FPI flows in equity
|
Week Ending |
FPI.Equity |
FPI.Equity.Primary |
FPI.Equity.Secondary |
|
13 Feb, 2026 |
19.4 |
24.0 |
-4.5 |
|
06 Feb, 2026 |
97.3 |
3.1 |
94.2 |
|
30 Jan, 2026 |
27.6 |
17.6 |
10.0 |
|
23 Jan, 2026 |
-97.4 |
5.5 |
-102.9 |
|
16 Jan, 2026 |
-116.0 |
5.2 |
-121.2 |
|
09 Jan, 2026 |
-85.1 |
0.3 |
-85.4 |
|
02 Jan, 2026 |
-131.7 |
1.3 |
-132.9 |
|
26 Dec, 2025 |
-43.9 |
5.4 |
-49.3 |
|
19 Dec, 2025 |
58.0 |
49.7 |
8.3 |
|
12 Dec, 2025 |
-59.8 |
37.4 |
-97.2 |
Source: NSDL
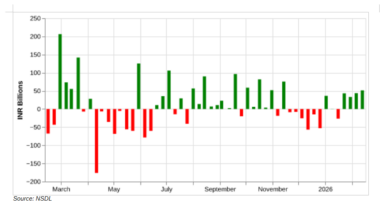
Figure: History of FPI flows in equity

Source: NSDL
FPI flows in Debt
The latest weekly data shows that foreign investors remained net buyers in Indian debt during the week ended February 13, 2026, recording net inflows of INR 51.39 billion, compared with net inflows of INR 43.40 billion in the previous week. This marks another week of positive debt flows and represents the strongest weekly inflow seen in the current phase, indicating continued improvement in foreign participation following the volatility observed earlier in the year.
Debt flows in recent months have picked up. After a poor December, during which FPI outflows were witnessed every week, FPI flows into debt turned sharply positive in 2026. Barring one week, FPI flows have been positive in 2026.
Table: Recent history of FPI flows in debt
|
Week Ending |
Net Investment (INR Billions) |
|
13 Feb, 2026 |
51.4 |
|
06 Feb, 2026 |
43.4 |
|
30 Jan, 2026 |
33.2 |
|
23 Jan, 2026 |
43.0 |
|
16 Jan, 2026 |
-26.5 |
|
09 Jan, 2026 |
0.2 |
|
02 Jan, 2026 |
36.2 |
|
26 Dec, 2025 |
-52.7 |
|
19 Dec, 2025 |
-14.8 |
|
12 Dec, 2025 |
-56.7 |
Source: NSDL
Figure: History of FPI flows in debt
Source: NSDL
Related Tags
![]() IIFL Customer Care Number
IIFL Customer Care Number
(Gold/NCD/NBFC/Insurance/NPS)
1860-267-3000 / 7039-050-000
![]() IIFL Capital Services Support WhatsApp Number
IIFL Capital Services Support WhatsApp Number
+91 9892691696
Download The App Now
Follow us on
2026, IIFL Capital Services Ltd. All Rights Reserved
IIFL Capital Services Limited - Stock Broker SEBI Regn. No: INZ000164132 (Member ID - NSE: 10975 BSE: 179 MCX: 55995 NCDEX: 01249), DP SEBI Reg. No. IN-DP-185-2016, PMS SEBI Regn. No: INP000002213, IA SEBI Regn. No: INA000000623, Merchant Banker SEBI Regn. No. INM000010940, RA SEBI Regn. No: INH000000248, BSE Enlistment Number (RA): 5016, AMFI-Registered Mutual Fund Distributor & SIF Distributor
ARN NO : 47791 (Date of initial registration – 17/02/2007; Current validity of ARN – 08/02/2027), PFRDA Reg. No. PoP 20092018, IRDAI Corporate Agent (Composite) : CA1099

This Certificate Demonstrates That IIFL As An Organization Has Defined And Put In Place Best-Practice Information Security Processes.


