
Summary
Table 1: Headline GDP Metrics
|
|
|
|
|
|
|
|
|
|
Source: MOSPI
India’s growth momentum remains firmly in expansion territory, though the composition of growth is now more important than the headline number itself. In the third quarter of FY26, real GDP growth came in at 7.82%, while nominal GDP growth stood at 8.93%. This represents a moderation from the previous quarter, when real GDP growth was 8.41%.
Despite this slowdown, the broader trend remains stable. Over the last three years, quarterly growth has largely stayed within a 6.6% to 8.4% range, indicating that India continues to operate within a relatively strong and consistent growth band.
The introduction of a new GDP series also changes how the data should be interpreted. A revised base year and improved methodology allow the data to better capture structural shifts in the economy – particularly formalisation, digitalisation, and the changing composition of sectors. For investors and policymakers, this means the GDP numbers now provide a clearer picture of where growth is actually coming from. Sectors that have seen a shift from informal to formal activity are likely to be reflected more accurately in the data, making growth analysis and sector allocation decisions more reliable.

Source – MOSPI
Table 2: Demand-Side Metrics
|
Component |
Latest (INR cr) |
QoQ |
YoY |
|
PFCE |
4,817,112.12 |
19.08% |
8.69% |
|
GFCE |
809,859.04 |
-2.15% |
4.75% |
|
GFCF |
2,594,068.32 |
-0.87% |
7.81% |
|
Exports |
1,829,209.92 |
5.01% |
5.55% |
|
Imports |
1,950,769.11 |
-1.00% |
8.55% |
Source: MOSPI
On the demand side, private consumption and investment remain the main drivers of growth.
Private consumption expenditure (PFCE) stands at roughly ₹48 lakh crore, continuing to anchor domestic demand. Gross Fixed Capital Formation (GFCF), which represents investment activity, is estimated at around ₹25–26 lakh crore, highlighting the continued role of capital spending in supporting growth.
Government consumption remains relatively contained at around ₹8 lakh crore, suggesting that policymakers are attempting to balance growth support with fiscal discipline.
The external sector remains a mild drag. Exports are estimated at about ₹18 lakh crore, while imports stand higher at roughly ₹19–19.5 lakh crore, creating a negative trade balance.
Overall, this demand mix indicates that India’s growth is being driven primarily by domestic consumption and investment, rather than external demand.
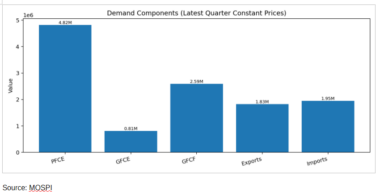
Table 3: Supply-Side GVA Growth
|
Sector |
Growth (Latest Quarter) |
|
Agriculture |
1.42% |
|
Manufacturing |
13.30% |
|
Construction |
6.57% |
|
Services |
~5-11% |
Source: MOSPI
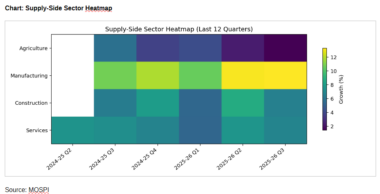
From a sectoral perspective, the latest Gross Value Added (GVA) data highlights the uneven nature of growth across the economy.
Manufacturing has emerged as the strongest growth engine, expanding by 13.3%.
Construction grew by 6.57%, reflecting continued infrastructure and real estate activity.
Services, with growth ranging between 5% and 11%, continue to provide stability to overall economic output.
Agriculture, however, grew by only 1.42%, making it the weakest link in the current growth cycle.
The strength in manufacturing is particularly important. It not only supports domestic value creation but also strengthens India’s export competitiveness and productivity across supply chains. Construction activity continues to generate employment and multiplier effects across the economy, while the services sector remains a stabilizing force for overall growth.
Agriculture, however, remains the key vulnerability in the current growth structure.
Looking at the broader trend helps put the latest numbers in context.
Over the past 12 quarters, India’s GDP growth has ranged between 6.60% and 8.41%, with an average of around 7.3%. While quarterly growth may fluctuate, the broader trend suggests a resilient and stable expansion path.
The sustainability of India’s growth momentum will depend largely on how demand and industrial activity evolve in the coming quarters.
Consumption and investment currently form the backbone of economic activity. If private consumption remains stable and investment activity continues to expand, growth can remain within the current high-growth range.
However, the risks lie in two areas. First, if agricultural growth remains weak, it could weigh on rural consumption. Second, if imports continue to outpace exports, the external sector could place a larger drag on overall growth.
For now, the key question is whether manufacturing and services can continue to offset agricultural softness. If industrial momentum remains strong and consumption stays resilient, India’s growth trajectory is likely to remain favourable, even if quarterly GDP prints fluctuate modestly.
Related Tags
![]() IIFL Customer Care Number
IIFL Customer Care Number
(Gold/NCD/NBFC/Insurance/NPS)
1860-267-3000 / 7039-050-000
![]() IIFL Capital Services Support WhatsApp Number
IIFL Capital Services Support WhatsApp Number
+91 9892691696
Download The App Now
Follow us on
2026, IIFL Capital Services Ltd. All Rights Reserved
IIFL Capital Services Limited - Stock Broker SEBI Regn. No: INZ000164132 (Member ID - NSE: 10975 BSE: 179 MCX: 55995 NCDEX: 01249), DP SEBI Reg. No. IN-DP-185-2016, PMS SEBI Regn. No: INP000002213, IA SEBI Regn. No: INA000000623, Merchant Banker SEBI Regn. No. INM000010940, RA SEBI Regn. No: INH000000248, BSE Enlistment Number (RA): 5016, AMFI-Registered Mutual Fund Distributor & SIF Distributor
ARN NO : 47791 (Date of initial registration – 17/02/2007; Current validity of ARN – 08/02/2027), PFRDA Reg. No. PoP 20092018, IRDAI Corporate Agent (Composite) : CA1099

This Certificate Demonstrates That IIFL As An Organization Has Defined And Put In Place Best-Practice Information Security Processes.


