
2 Feb 2026 , 05:53 PM

Weekly Market Wrap – Market Gains in the Pre-Budget week
After a sharp sell-off in the previous week, the market witnessed a selective recovery, with volatility remaining elevated and gains confined to a few sectors. The NIFTY 50 rose 1.09%, snapping last week’s losing streak; however, the rebound lacked strong follow-through. Unlike the prior week, when selling was broad-based, banking stocks provided support this time, with the NIFTY BANK gaining 1.95%. Meanwhile, the NIFTY IT slipped 0.53%, as continued weakness in heavyweight IT stocks capped broader upside.
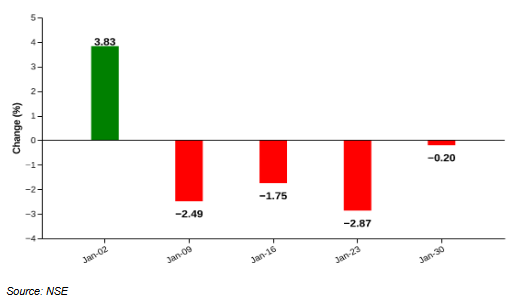
Sectoral trends were mixed during the week. The NIFTY ENERGY surged 6.16%, marking a sharp rebound after sustained losses, while the NIFTY REALTY rose 3.52%, recovering from last week’s steep decline. In contrast, the NIFTY FMCG fell 0.86%, extending its losing streak. The NIFTY AUTO edged lower by 0.20%, remaining under pressure, and the NIFTY PHARMA ended nearly flat at -0.03%, indicating a pause in recent weakness amid still-cautious sentiment.
NIFTY 50 – Recovers on Banking and Infrastructure Support
Weekly Performance: 1.1%
| date | open | high | low | close |
| 2026-01-23 | 25344.6 | 25348.0 | 25025.3 | 25048.7 |
| 2026-01-27 | 25063.3 | 25246.7 | 24932.5 | 25175.4 |
| 2026-01-28 | 25258.8 | 25372.1 | 25187.7 | 25342.8 |
| 2026-01-29 | 25345.0 | 25458.2 | 25159.8 | 25418.9 |
| 2026-01-30 | 25247.5 | 25370.7 | 25213.7 | 25320.7 |
Source: NSE
Figure: Recent performance
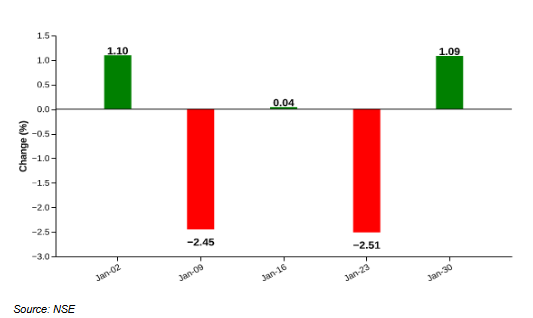
The NIFTY 50 rose 1.09% in the week ended 30 January 2026, snapping its losing streak after a 2.51% decline in the previous week. However, the move reflected a modest recovery rather than a clear trend of reversal. The rebound was led by banking and infrastructure heavyweights, with Axis Bank rising 9%, supported by HDFC Bank (+1.5%), Larsen & Toubro (+2.3%), and State Bank of India (+1.9%). BEL surged 9.3%, providing additional support.
On the downside, Kotak Mahindra Bank (-3.8%), Infosys (-1.9%), and Asian Paints (-10.2%) capped the index’s upside. Market breadth was positive, with 33 stocks advancing against 16 declining.
NIFTY MIDCAP SELECT – Recovers After Sharp Prior Week Decline
Weekly Performance: 2.6%
| date | open | high | low | close |
| 2026-01-23 | 13388.3 | 13388.9 | 13044.0 | 13066.6 |
| 2026-01-27 | 13119.2 | 13181.0 | 12935.1 | 13137.9 |
| 2026-01-28 | 13191.7 | 13402.1 | 13176.9 | 13381.9 |
| 2026-01-29 | 13415.5 | 13433.9 | 13270.4 | 13424.4 |
| 2026-01-30 | 13360.4 | 13462.1 | 13273.8 | 13400.0 |
Source: NSE
Figure: Recent performance
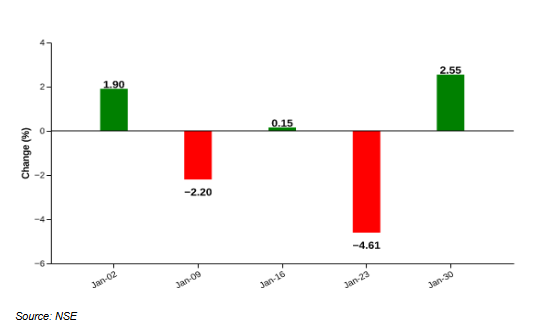
The NIFTY MIDCAP SELECT index advanced 2.55% in the week ended 30 January 2026, reversing the steep 4.61% decline recorded in the previous week. The recovery was led by stocks such as BSE Ltd, Indus Towers, BHEL, Idea Cellular, and Aurobindo Pharma, which together contributed meaningfully to the upside. Meanwhile, Max Healthcare, Colgate-Palmolive (India), Persistent Systems, PolicyBazaar, and Marico posted declines, capping the index’s gains. Market breadth was supportive, with 19 stocks advancing against 6 declining.
NIFTY IT – Slides as Heavyweights Drag the Index Lower
Weekly Performance: -0.5%
| date | open | high | low | close |
| 2026-01-23 | 38513.7 | 38576.6 | 38149.3 | 38238.5 |
| 2026-01-26 | 38238.5 | 38238.5 | 38238.5 | 38238.5 |
| 2026-01-27 | 38482.9 | 38677.6 | 38074.8 | 38566.1 |
| 2026-01-28 | 38583.1 | 38792.6 | 38433.4 | 38725.4 |
| 2026-01-29 | 38601.9 | 38635.6 | 38063.4 | 38431.3 |
| 2026-01-30 | 38262.6 | 38262.6 | 37704.4 | 38036.1 |
Source: NSE
Figure: Recent performance
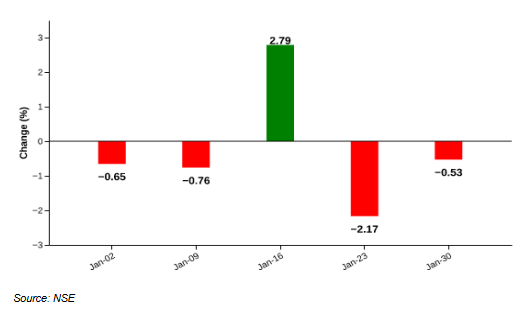
The NIFTY IT index fell 0.53% in the week ended 30 January 2026, extending its decline after the previous week’s 2.17% drop and marking four losses in the last five weeks. The downside was driven by losses in Infosys (-1.85%) and TCS (-1.22%), along with weakness in Persistent Systems, HCLTech, and OFSS (-2.46%), which together dragged the index lower.
On the positive side, Tech Mahindra (+2.47%), L&T Infotech, Coforge, and Mphasis posted gains; however, their support was insufficient to offset the broader weakness. Market breadth remained weak, with 6 stocks declining against 4 advancing.
NIFTY BANK – Rebounds as Key Lenders Move Higher
Weekly Performance: 1.9%
| date | open | high | low | close |
| 2026-01-23 | 59305.1 | 59400.1 | 58346.2 | 58473.1 |
| 2026-01-26 | 58473.1 | 58473.1 | 58473.1 | 58473.1 |
| 2026-01-27 | 58366.1 | 59436.8 | 58121.6 | 59205.4 |
| 2026-01-28 | 59575.6 | 59699.9 | 59240.1 | 59598.8 |
| 2026-01-29 | 59416.2 | 60060.7 | 59339.0 | 59957.9 |
| 2026-01-30 | 59542.2 | 59906.9 | 59501.8 | 59610.4 |
Source: NSE
Figure: Recent performance
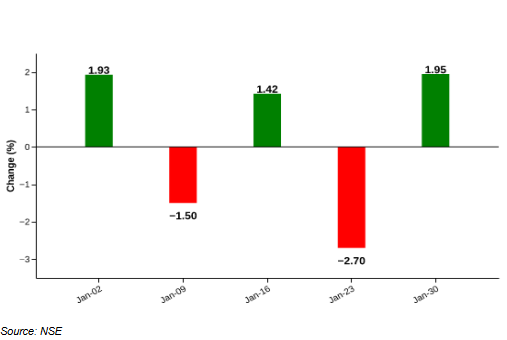
The NIFTY BANK index rose 1.95% in the week ended 30 January 2026, reversing the decline recorded in the previous week and indicating a short-term recovery in banking stocks. The strength was driven by sharp gains in Axis Bank (+9.00%), State Bank of India (+4.63%), HDFC Bank (+1.47%), ICICI Bank (+0.86%), and Federal Bank (+3.30%), which together provided strong support to the index.
However, the upside was partly capped by losses in Kotak Mahindra Bank (-3.82%) and Canara Bank (-2.89%), which limited the index gains. Market breadth remained positive, with 10 stocks advancing against 2 declines.
NIFTY ENERGY – Rallies as Oil & Gas Heavyweights Drive Sharp Recovery
Weekly Performance: 6.2%
| date | open | high | low | close |
| 2026-01-23 | 33867.3 | 33867.3 | 33055.3 | 33098.3 |
| 2026-01-26 | 33098.3 | 33098.3 | 33098.3 | 33098.3 |
| 2026-01-27 | 33252.4 | 33410.0 | 32890.3 | 33293.1 |
| 2026-01-28 | 33434.3 | 34745.9 | 33424.1 | 34685.4 |
| 2026-01-29 | 34890.1 | 35427.4 | 34757.8 | 35335.2 |
| 2026-01-30 | 35220.1 | 35233.9 | 34827.9 | 35138.1 |
Source: NSE
Figure: Recent performance
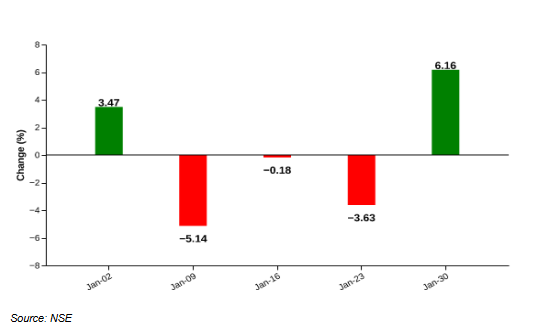
The NIFTY ENERGY index surged 6.16% in the week ended 30 January 2026, reversing the losses recorded over the previous three weeks and marking a strong recovery. The rally was led by sharp gains in ONGC (+9.57%), ABB (+18.79%), Coal India (+5.34%), Gujarat State Petroleum Corporation (+19.20%), and OIL (+17.06%), which together lifted the index significantly.
Meanwhile, JSW Energy (-3.74%), Mahanagar Gas (-2.25%), and Thermax (-1.44%) registered losses, though their impact remained limited. Market breadth was decisively positive, with 36 stocks advancing against 4 declines.
NIFTY FMCG – Continues Losing Streak on Sectoral Pressure
Weekly Performance: -0.9%
| date | open | high | low | close |
| 2026-01-23 | 52135.6 | 52217.5 | 51594.1 | 51662.1 |
| 2026-01-26 | 51662.1 | 51662.1 | 51662.1 | 51662.1 |
| 2026-01-27 | 51692.2 | 51741.4 | 51126.8 | 51349.8 |
| 2026-01-28 | 51449.8 | 51579.2 | 50510.6 | 50985.4 |
| 2026-01-29 | 50971.4 | 51002.0 | 50076.1 | 50523.9 |
| 2026-01-30 | 50420.5 | 51339.4 | 50311.5 | 51215.2 |
Source: NSE
Figure: Recent performance
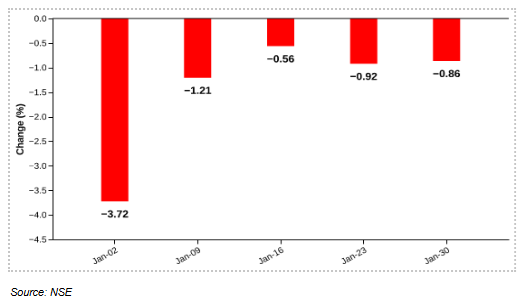
The NIFTY FMCG index declined 0.86% in the week ended 30 January 2026, extending its losing streak to five consecutive weeks. The weakness was driven by sharp declines in Godrej Consumer Products (-6.96%), Hindustan Unilever (-1.51%), Tata Consumer Products (-1.70%), Radico Khaitan (-4.52%), and ITC (-0.39%), which together exerted significant pressure on the index.
The fall was partly cushioned by gains in Nestlé India (+2.86%), United Spirits (+2.22%), United Breweries (+1.87%), and Britannia (+0.44%); however, their support was insufficient to offset the broader weakness. Market breadth remained negative, with 4 stocks advancing against 11 declining.
NIFTY AUTO – Slight Dip Extends Ongoing Downtrend
Weekly Performance: -0.2%
| date | open | high | low | close |
| 2026-01-23 | 27171.1 | 27230.8 | 26766.7 | 26804.6 |
| 2026-01-26 | 26804.6 | 26804.6 | 26804.6 | 26804.6 |
| 2026-01-27 | 26619.1 | 26728.8 | 26218.3 | 26554.0 |
| 2026-01-28 | 26530.3 | 26781.7 | 26236.7 | 26737.6 |
| 2026-01-29 | 26763.0 | 26775.3 | 26170.4 | 26555.4 |
| 2026-01-30 | 26287.3 | 26812.2 | 26253.6 | 26750.3 |
Source: NSE
Figure: Recent performance
Source: NSE
The NIFTY AUTO index slipped 0.20% in the week ended 30 January 2026, extending its ongoing downtrend despite the pace of losses moderating compared with previous weeks. The decline was driven by weakness in heavyweight stocks Maruti Suzuki and Mahindra & Mahindra, along with losses in MRF, Balkrishna Industries, and Exide Industries, which together dragged the index lower. The downside was partly cushioned by gains in TVS Motor, Motherson, Bajaj Auto, TI India, and Eicher Motors, offering selective support. Market breadth remained relatively positive, with 9 stocks advancing against 5 declines.
NIFTY PHARMA – Mild Pullback with Market Breadth Holding Firm
Weekly Performance: -0.0%
| date | open | high | low | close |
| 2026-01-23 | 22007.1 | 22033.5 | 21676.4 | 21722.2 |
| 2026-01-26 | 21722.2 | 21722.2 | 21722.2 | 21722.2 |
| 2026-01-27 | 21891.8 | 21898.3 | 21632.8 | 21788.4 |
| 2026-01-28 | 21828.0 | 21903.8 | 21622.9 | 21739.8 |
| 2026-01-29 | 21781.1 | 21798.0 | 21467.3 | 21564.0 |
| 2026-01-30 | 21544.5 | 21768.9 | 21396.3 | 21715.1 |
Source: NSE
Figure: Recent performance
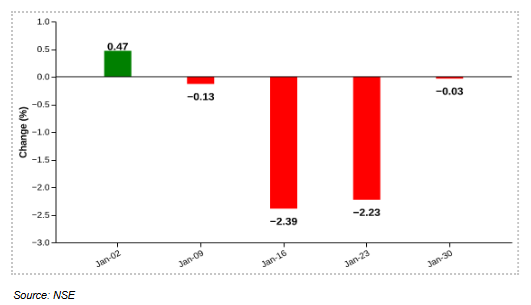
The NIFTY PHARMA index slipped 0.03% in the week ended 30 January 2026, following two consecutive weeks of sharp declines and signalling a pause in the recent weakness rather than a clear reversal. Selling pressure was led by Sun Pharma (-2.24%), along with declines in Laurus Labs, Dr. Reddy’s Laboratories, Alkermes, and Abbott India, which together weighed on the index. In contrast, Aurobindo Pharma (+6.60%) and Gland Pharma (+9.80%) posted strong gains, supported by mild advances in Cipla, Divi’s Laboratories, and Glenmark, helping limit the downside. Market breadth remained healthy, with 15 stocks advancing against 5 declines.
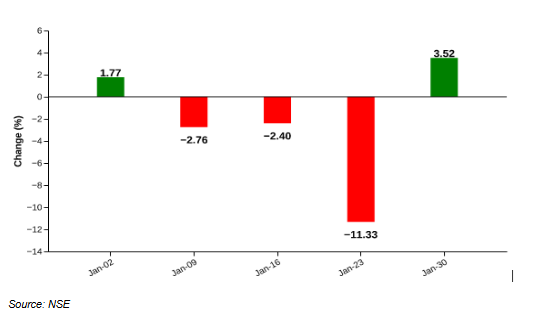
NIFTY REALTY – Sharp Rebound as Realty Leaders Lead Recovery
Weekly Performance: 3.5%
| date | open | high | low | close |
| 2026-01-23 | 785.9 | 786.0 | 754.5 | 756.4 |
| 2026-01-27 | 759.9 | 763.9 | 742.2 | 759.4 |
| 2026-01-28 | 761.7 | 776.1 | 759.2 | 771.3 |
| 2026-01-29 | 772.8 | 779.8 | 764.6 | 776.5 |
| 2026-01-30 | 773.2 | 784.5 | 766.6 | 783.0 |
Source: NSE
Figure: Recent performance
Source: NSE
The NIFTY REALTY index rose 3.52% in the week ended 30 January 2026, reversing the sharp 11.33% decline recorded in the previous week and marking a strong rebound in real estate stocks. The recovery was led by gains in DLF (+8.04%), Lodha Developers (+7.91%), and Prestige Estates (+5.23%), with additional support from Godrej Properties and Oberoi Realty, which together lifted the index higher. However, the upside was partly capped by declines in Phoenix Mills (-3.23%) and Brigade Enterprises (-1.04%). Market breadth remained strong, with 8 stocks advancing against 2 declines.
Related Tags
![]() IIFL Customer Care Number
IIFL Customer Care Number
(Gold/NCD/NBFC/Insurance/NPS)
1860-267-3000 / 7039-050-000
![]() IIFL Capital Services Support WhatsApp Number
IIFL Capital Services Support WhatsApp Number
+91 9892691696
Download The App Now
Follow us on
2026, IIFL Capital Services Ltd. All Rights Reserved
IIFL Capital Services Limited - Stock Broker SEBI Regn. No: INZ000164132 (Member ID - NSE: 10975 BSE: 179 MCX: 55995 NCDEX: 01249), DP SEBI Reg. No. IN-DP-185-2016, PMS SEBI Regn. No: INP000002213, IA SEBI Regn. No: INA000000623, Merchant Banker SEBI Regn. No. INM000010940, RA SEBI Regn. No: INH000000248, BSE Enlistment Number (RA): 5016, AMFI-Registered Mutual Fund Distributor & SIF Distributor
ARN NO : 47791 (Date of initial registration – 17/02/2007; Current validity of ARN – 08/02/2027), PFRDA Reg. No. PoP 20092018, IRDAI Corporate Agent (Composite) : CA1099

This Certificate Demonstrates That IIFL As An Organization Has Defined And Put In Place Best-Practice Information Security Processes.


