
In December 2025, the Nifty Midcap 100 index had a negative return of -0.92%, snapping the previous month’s gains amid broad-based market weakness. This was driven by a decline in IT, Consumer Discretionary and Healthcare stocks. On the other hand, Commodities emerged as the top performing sector. Market breadth weakened significantly, with only 37 stocks advancing and 63 declining, pushing the Advance-Decline Ratio down to 0.59.
Chart: Monthly Return Chart
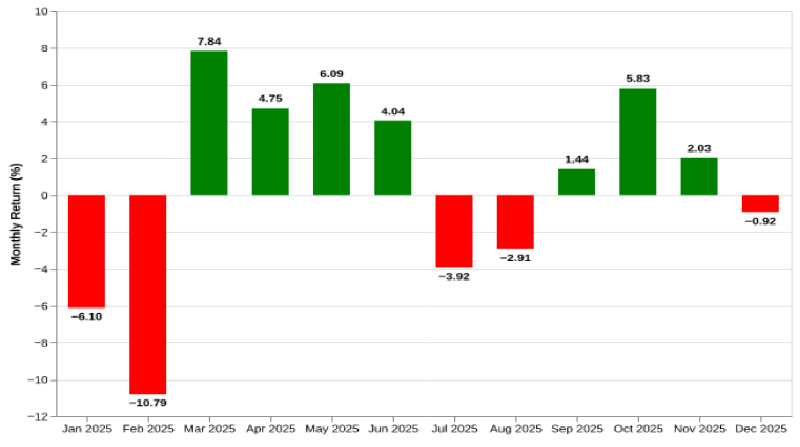
Source: NSE
How was the market breadth: 37 advances, while 63 declines:
In Dec 2025, the market breadth was negative. 37 stocks advanced while 63 stocks declined. This was significantly worse than the previous month, with the advance-decline ratio falling from 0.72 to 0.59.
Table: Advances and Declines history
| Month | Advances | Declines | Advance/Decline Ratio
close |
| Dec-2025 | 37 | 63 | 0.59 |
| Nov-2025 | 42 | 58 | 0.72 |
| Oct-2025 | 79 | 21 | 3.76 |
| Sep-2025 | 61 | 39 | 1.56 |
| Aug-2025 | 32 | 68 | 0.47 |
| Jul-2025 | 25 | 75 | 0.33 |
| Jun-2025 | 67 | 33 | 2.03 |
| May-2025 | 78 | 22 | 3.55 |
| Apr-2025 | 73 | 27 | 2.7 |
| Mar-2025 | 88 | 12 | 7.33 |
| Feb-2025 | 3 | 97 | 0.03 |
| Jan-2025 | 31 | 69 | 0.45 |
Source: NSE
Chart: Trends In ADR Ratio
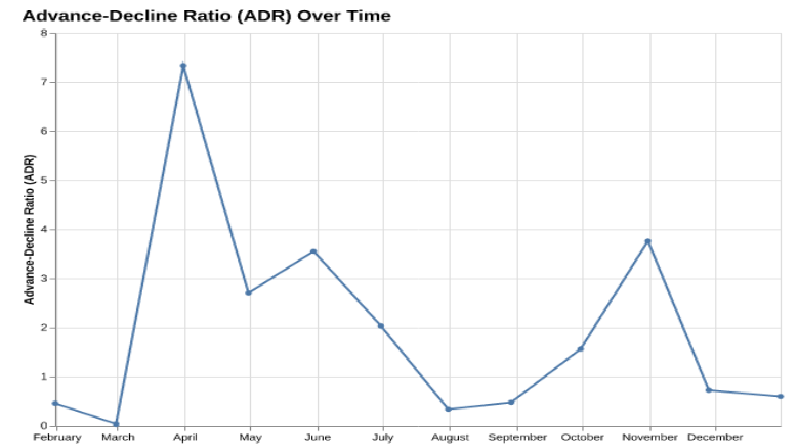
Source: NSE
Commodities performs the best while Information Technology performs the worst:
Commodities was the best-performing sector in the latest month with a weighted return of 4.72%, driven by strong performances from stocks like Hindustan Zinc Ltd, National Aluminium Company Ltd, and NMDC Ltd. On the other hand, the worst-performing sector was Information Technology, which saw a decline of 4.88%. Key contributors to this downturn included Coforge Ltd, Tata Technologies Ltd, and Oracle Financial Services Software Ltd.
Table: Performance Across Sectors
| Sector | Number Of Stocks | % Change (w. avg) | % Change (avg) |
| Commodities | 9 | 4.72 | 6.65 |
| Telecommunication | 4 | 4.13 | 3.99 |
| Energy | 5 | 3.28 | 1.46 |
| Utilities | 4 | 0.59 | -0.44 |
| Industrials | 16 | 0.56 | -0.63 |
| Fast Moving Consumer Goods | 3 | -0.42 | -1.21 |
| Financial Services | 23 | -1.08 | -0.71 |
| Services | 2 | -1.22 | -0.47 |
| Healthcare | 7 | -3.62 | -2.07 |
| Consumer Discretionary | 20 | -4.21 | -3.36 |
| Information Technology | 7 | -4.88 | -4.0 |
Source: NSE
Chart: Sector Performance Heatmap Over the Past Year
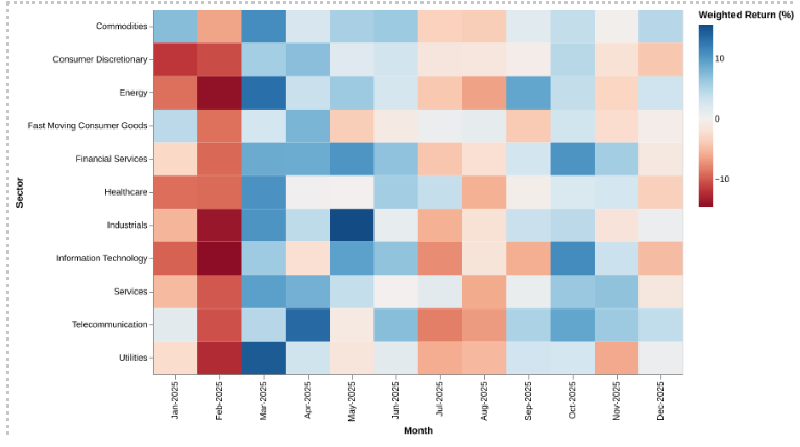
Source: NSE
Top performers over a 1 Year Horizon:
Over the past year, the top performers were led by L&T Finance Ltd, Aditya Birla Capital Ltd, and Muthoot Finance Ltd with returns of 136.68%, 101.16%, and 80.62%, respectively. These stocks were primarily from the Financial Services sector.
Table: Top-15
| Stock | Sector | % Change (1Y) |
| L&T Finance Ltd | Financial Services | 136.68 |
| Aditya Birla Capital Ltd | Financial Services | 101.16 |
| Muthoot Finance Ltd | Financial Services | 80.62 |
| AU Small Finance Bank Ltd | Financial Services | 78.09 |
| Ashok Leyland Ltd | Industrials | 66.53 |
| Indian Bank | Financial Services | 62.03 |
| FSN E-Commerce Ventures Ltd | Consumer Discretionary | 61.91 |
| UPL Ltd | Commodities | 60.16 |
| Mahindra Mahindra Financial Services Ltd | Financial Services | 55.88 |
| National Aluminium Company Ltd | Commodities | 55.75 |
| Max Financial Services Ltd | Financial Services | 50.09 |
| BSE Ltd | Financial Services | 48.28 |
| Bank of India | Financial Services | 41.17 |
| Hindustan Zinc Ltd | Commodities | 40.68 |
| SRF Ltd | Commodities | 38.46 |
Source: NSE
Bottom performers over a 1 Year Horizon:
Over the past year, the bottom performers included Ola Electric Mobility Ltd, Premier Energies Ltd, and Oracle Financial Services Software Ltd with returns of -57.73%, -37.68%, and -37.01%, respectively. These stocks were primarily from the Consumer Discretionary and Industrials sectors.
Table: Bottom-15
| Stock | Sector | % Change (1Y) |
| Ola Electric Mobility Ltd | Consumer Discretionary | -57.73 |
| Premier Energies Ltd | Industrials | -37.68 |
| Oracle Financial Services Software Ltd | Information Technology | -37.01 |
| Kalyan Jewellers India Ltd | Consumer Discretionary | -36.47 |
| Indian Renewable Energy Development Agency Ltd | Financial Services | -35.01 |
| Dixon Technologies (India) Ltd | Consumer Discretionary | -32.5 |
| Godrej Properties Ltd | Consumer Discretionary | -28.07 |
| Supreme Industries Ltd | Industrials | -28.05 |
| Oberoi Realty Ltd | Consumer Discretionary | -27.39 |
| SJVN Ltd | Utilities | -27.27 |
| Tube Investments of India Ltd | Consumer Discretionary | -26.82 |
| Tata Technologies Ltd | Information Technology | -26.72 |
| IRB Infrastructure Developers Ltd | Industrials | -26.16 |
| NTPC Green Energy Ltd | Utilities | -25.66 |
| Adani Total Gas Ltd | Energy | -25.51 |
Source: NSE
Stocks Near 52 Week Highs:
As of the end of last month, nearly 33 stocks were more than 20% away from their 52-week highs. Around 43 stocks were within 10% of their 52-week highs, with L&T Finance Ltd, Bank of Maharashtra, and IDFC First Bank Ltd being the closest.
Table: Stocks within 10% of 52 Week High
| Stock | Sector | Last Close | 52 Week High | vs 52 Week High (%) |
| L&T Finance Ltd | Financial Services | 315.95 | 315.95 | 0.0 |
| Bank of Maharashtra | Financial Services | 62.05 | 62.05 | 0.0 |
| IDFC First Bank Ltd | Financial Services | 85.61 | 85.61 | 0.0 |
| Ashok Leyland Ltd | Industrials | 179.19 | 179.19 | 0.0 |
| Phoenix Mills Ltd | Consumer Discretionary | 1853.5 | 1853.5 | 0.0 |
| Hindustan Petroleum Corporation Ltd | Energy | 499.05 | 499.05 | 0.0 |
| UPL Ltd | Commodities | 795.15 | 795.15 | 0.0 |
| Steel Authority of India Ltd | Commodities | 146.99 | 146.99 | 0.0 |
| Bharat Forge Ltd | Consumer Discretionary | 1470.4 | 1470.4 | 0.0 |
| APL Apollo Tubes Ltd | Industrials | 1914.0 | 1914.2189 | -0.01 |
| AU Small Finance Bank Ltd | Financial Services | 994.5 | 996.45 | -0.2 |
| NMDC Ltd | Commodities | 83.17 | 83.41 | -0.29 |
| Mahindra Mahindra Financial Services Ltd | Financial Services | 403.0 | 404.4 | -0.35 |
| National Aluminium Company Ltd | Commodities | 314.3 | 316.6 | -0.73 |
| Federal Bank Ltd | Financial Services | 267.1 | 269.15 | -0.76 |
| Muthoot Finance Ltd | Financial Services | 3811.7 | 3856.4 | -1.16 |
| Bharat Heavy Electricals Ltd | Industrials | 287.45 | 291.0 | -1.22 |
| Marico Ltd | Fast Moving Consumer Goods | 750.6 | 760.7 | -1.33 |
| Union Bank of India | Financial Services | 153.76 | 156.29 | -1.62 |
| Indus Towers Ltd | Telecommunication | 418.75 | 425.75 | -1.64 |
| Aditya Birla Capital Ltd | Financial Services | 357.7 | 364.05 | -1.74 |
| FSN E-Commerce Ventures Ltd | Consumer Discretionary | 265.15 | 271.16 | -2.22 |
| Polycab India Ltd | Industrials | 7619.0 | 7845.0 | -2.88 |
| Escorts Kubota Ltd | Industrials | 3719.8 | 3847.8 | -3.33 |
| Bank of India | Financial Services | 143.85 | 148.85 | -3.36 |
| Cummins India Ltd | Industrials | 4434.4 | 4600.2 | -3.6 |
| GMR Airports Ltd | Services | 104.37 | 108.35 | -3.67 |
| Max Financial Services Ltd | Financial Services | 1671.8 | 1736.7 | -3.74 |
| Hindustan Zinc Ltd | Commodities | 612.45 | 636.85 | -3.83 |
| Persistent Systems Ltd | Information Technology | 6272.0 | 6570.0 | -4.54 |
| Alkem Laboratories Ltd | Healthcare | 5506.5 | 5773.0 | -4.62 |
| One 97 Communications Ltd | Financial Services | 1298.9 | 1367.8 | -5.04 |
| MRF Ltd | Consumer Discretionary | 152855.0 | 162291.7958 | -5.81 |
| Indian Bank | Financial Services | 837.25 | 890.15 | -5.94 |
| SRF Ltd | Commodities | 3075.0 | 3281.2059 | -6.28 |
| Housing Urban Development Corporation Ltd | Financial Services | 228.13 | 244.1001 | -6.54 |
| Biocon Ltd | Healthcare | 393.9 | 421.6 | -6.57 |
| Tata Communications Ltd | Telecommunication | 1825.3 | 1960.0 | -6.87 |
| Apollo Tyres Ltd | Consumer Discretionary | 500.0 | 536.9 | -6.87 |
| Mphasis Ltd | Information Technology | 2791.2 | 3000.6 | -6.98 |
| Bharti Hexacom Ltd | Telecommunication | 1821.7 | 1973.7261 | -7.7 |
| Glenmark Pharmaceuticals Ltd | Healthcare | 2035.2 | 2221.2516 | -8.38 |
| HDFC Asset Management Company Ltd | Financial Services | 2672.2 | 2946.0 | -9.29 |
Source: NSE
Chart: Distribution of stocks vs their 52-week highs
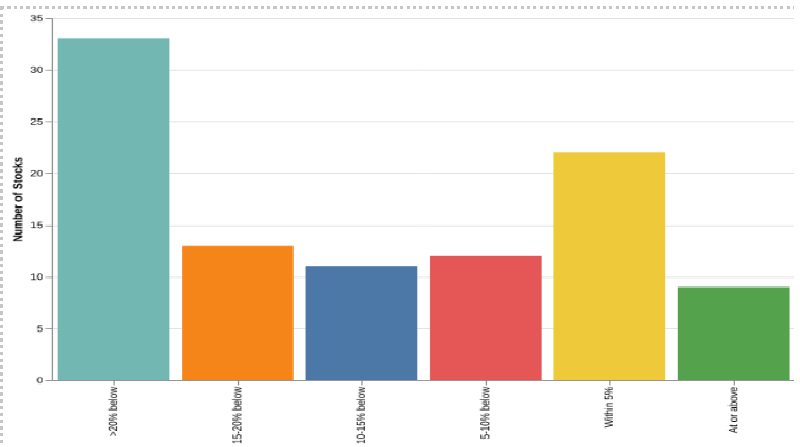
Source: NSE
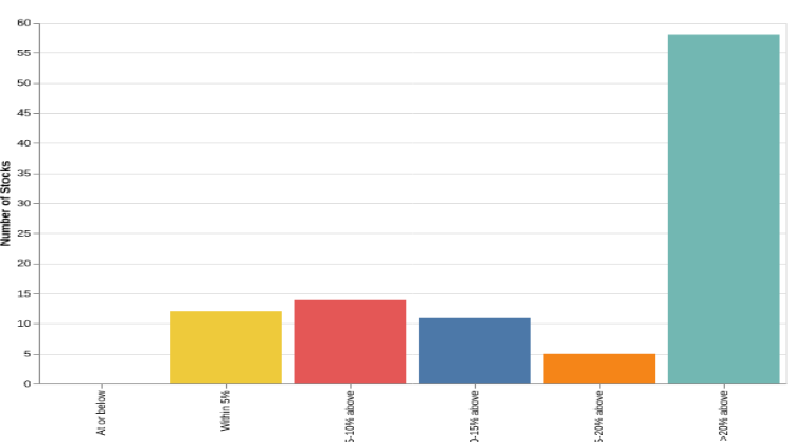
Stocks Near 52 Week Lows:
As of the end of last month, nearly 58 stocks were more than 20% away from their 52-week lows. Only 12 stocks were within 5% of their 52-week lows, with Premier Energies Ltd, ACC Ltd, and Jubilant Foodworks Ltd being the closest.
Table: Stocks within 10% of 52 Week Low
| Stock | Sector | Last Close | 52 Week Low | vs 52 Week Low |
| Exide Industries Ltd | Consumer Discretionary | 362.2 | 331.2636 | 9.34 |
| Petronet LNG Ltd | Energy | 284.1 | 260.2012 | 9.18 |
| Indian Railway Catering Tourism Corporation Ltd | Consumer Discretionary | 684.6 | 661.3 | 3.52 |
| ACC Ltd | Commodities | 1737.7 | 1725.2 | 0.72 |
| Patanjali Foods Ltd | Fast Moving Consumer Goods | 545.5 | 528.75 | 3.17 |
| Container Corporation Of India Ltd | Services | 524.95 | 495.05 | 6.04 |
| Torrent Power Ltd | Utilities | 1306.7 | 1200.0 | 8.89 |
| Max Healthcare Institute Ltd | Healthcare | 1045.1 | 963.1885 | 8.5 |
| P I Industries Ltd | Commodities | 3238.2 | 2979.7875 | 8.67 |
| Mankind Pharma Ltd | Healthcare | 2196.5 | 2106.0 | 4.3 |
| NTPC Green Energy Ltd | Utilities | 94.55 | 87.08 | 8.58 |
| Suzlon Energy Ltd | Industrials | 52.67 | 49.71 | 5.95 |
| Aditya Birla Fashion Retail Ltd | Consumer Discretionary | 76.78 | 72.47 | 5.95 |
| Page Industries Ltd | Consumer Discretionary | 36045.0 | 35565.0 | 1.35 |
| Colgate-Palmolive (India) Ltd | Fast Moving Consumer Goods | 2075.7 | 2053.4 | 1.09 |
| Jubilant Foodworks Ltd | Consumer Discretionary | 558.6 | 554.05 | 0.82 |
| Adani Total Gas Ltd | Energy | 566.7 | 546.9467 | 3.61 |
| Tata Technologies Ltd | Information Technology | 643.0 | 598.95 | 7.35 |
| Godrej Properties Ltd | Consumer Discretionary | 2004.4 | 1927.15 | 4.01 |
| Tube Investments of India Ltd | Consumer Discretionary | 2614.1 | 2460.8915 | 6.23 |
| Supreme Industries Ltd | Industrials | 3353.8 | 3094.1455 | 8.39 |
| IRB Infrastructure Developers Ltd | Industrials | 42.05 | 40.76 | 3.16 |
| SJVN Ltd | Utilities | 74.76 | 70.37 | 6.24 |
| Dixon Technologies (India) Ltd | Consumer Discretionary | 12102.0 | 11767.0 | 2.85 |
| Indian Renewable Energy Development Agency Ltd | Financial Services | 139.9 | 131.21 | 6.62 |
Source: NSE
Chart: Distribution of stocks vs their 52 week Low
Source: NSE
Related Tags
![]() IIFL Customer Care Number
IIFL Customer Care Number
(Gold/NCD/NBFC/Insurance/NPS)
1860-267-3000 / 7039-050-000
![]() IIFL Capital Services Support WhatsApp Number
IIFL Capital Services Support WhatsApp Number
+91 9892691696
Download The App Now
Follow us on
2026, IIFL Capital Services Ltd. All Rights Reserved
IIFL Capital Services Limited - Stock Broker SEBI Regn. No: INZ000164132 (Member ID - NSE: 10975 BSE: 179 MCX: 55995 NCDEX: 01249), DP SEBI Reg. No. IN-DP-185-2016, PMS SEBI Regn. No: INP000002213, IA SEBI Regn. No: INA000000623, Merchant Banker SEBI Regn. No. INM000010940, RA SEBI Regn. No: INH000000248, BSE Enlistment Number (RA): 5016, AMFI-Registered Mutual Fund Distributor & SIF Distributor
ARN NO : 47791 (Date of initial registration – 17/02/2007; Current validity of ARN – 08/02/2027), PFRDA Reg. No. PoP 20092018, IRDAI Corporate Agent (Composite) : CA1099

This Certificate Demonstrates That IIFL As An Organization Has Defined And Put In Place Best-Practice Information Security Processes.


