

In December 2025, the Nifty 50 index posted a negative return of -0.28%. This reversed the previous month’s gains and was driven by a decline in Healthcare and Industrials stocks. On the other hand, Commodities and IT stocks were among the best performers. Market breadth remained positive, with 28 stocks advancing versus 22 declining.
Chart: Monthly Return Chart
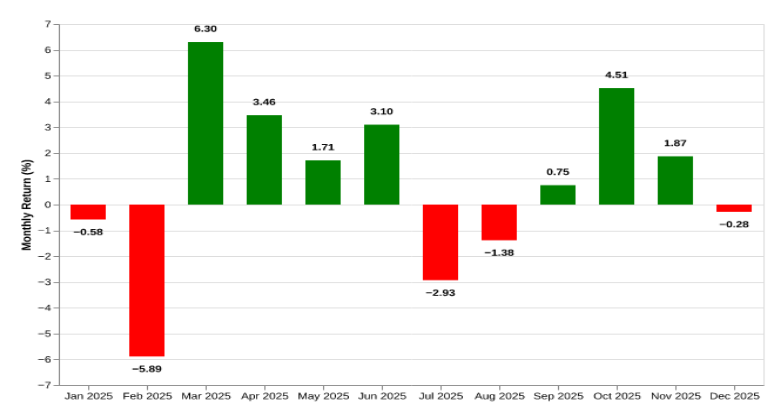
Source: NSE
How was the market breadth: 28 advances, while 22 declines:
In Dec-2025, the market breadth was positive. 28 stocks advanced while 22 stocks declined. In comparison to the last month, this is marginally worse, as November saw a higher advance-decline ratio of 1.38 versus 1.27.
Table: Advances and Declines history
| Month | Advances | Declines | Advance/Decline Ratio
close |
| Dec-2025 | 28 | 22 | 1.27 |
| Nov-2025 | 29 | 21 | 1.38 |
| Oct-2025 | 39 | 10 | 3.9 |
| Sep-2025 | 25 | 24 | 1.04 |
| Aug-2025 | 19 | 30 | 0.63 |
| Jul-2025 | 15 | 34 | 0.44 |
| Jun-2025 | 37 | 11 | 3.36 |
| May-2025 | 34 | 15 | 2.27 |
| Apr-2025 | 33 | 16 | 2.06 |
| Mar-2025 | 41 | 8 | 5.12 |
| Feb-2025 | 9 | 40 | 0.22 |
| Jan-2025 | 24 | 25 | 0.96 |
Source: NSE
Chart: Trends In ADR Ratio
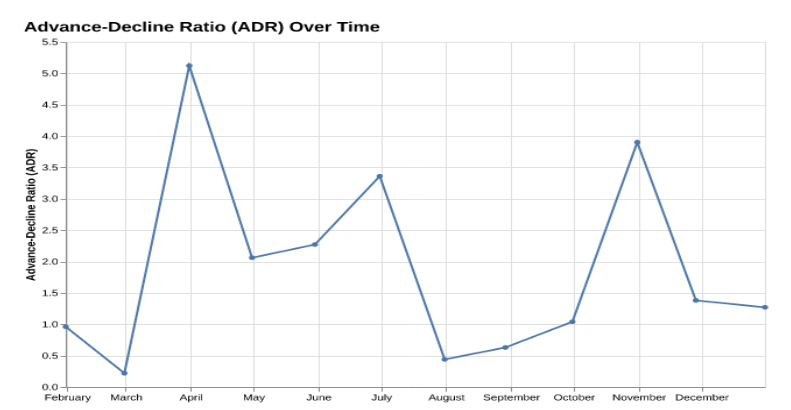
Source: NSE
Commodities performs the best while Healthcare performs the worst:
Commodities was the best-performing sector in the latest month with a weighted return of 3.74%, driven by strong performances from stocks like Hindalco Industries Ltd, Tata Steel Ltd, and Grasim Industries Ltd. On the other hand, the worst-performing sector was Healthcare, which saw a decline of 3.45%. Key contributors to this downturn included Sun Pharmaceutical Industries Ltd, and Apollo Hospitals Enterprise Ltd.
Table: Performance Across Sectors
| Sector | Number Of Stocks | % Change (w. avg) | % Change (avg) |
| Commodities | 6 | 3.74 | 3.39 |
| Information Technology | 5 | 3.04 | 3.23 |
| Energy | 3 | 0.52 | 1.69 |
| Telecommunication | 1 | 0.33 | 0.33 |
| Consumer Discretionary | 10 | -0.25 | 0.01 |
| Utilities | 2 | -0.38 | -0.52 |
| Industrials | 2 | -0.46 | -1.3 |
| Fast Moving Consumer Goods | 4 | -1.13 | -0.3 |
| Financial Services | 12 | -1.14 | 0.54 |
| Services | 1 | -3.11 | -3.11 |
| Healthcare | 4 | -3.45 | -2.6 |
Source: NSE
Chart: Sector Performance Heatmap Over the Past Year
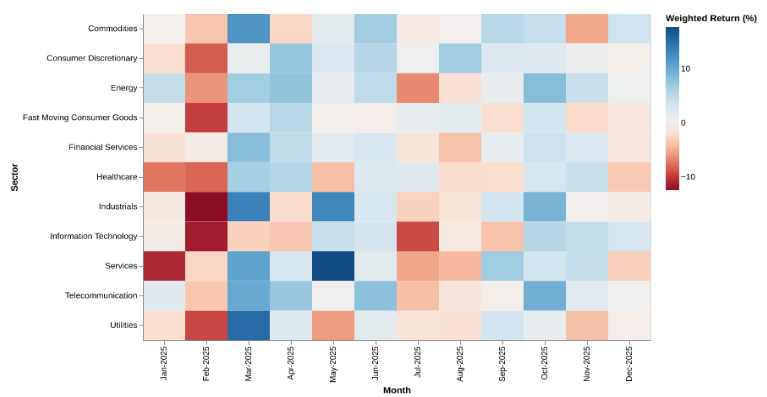
Source: NSE
Top performers over a 1 Year Horizon:
Over the past year, the top performers were led by Shriram Finance Ltd, Maruti Suzuki India Ltd, and Eicher Motors Ltd with returns of 75.05%, 55.43%, and 53.62%, respectively. These stocks were primarily from the Financial Services and Consumer Discretionary sectors.
Table: Top-15
| Stock | Sector | % Change (1Y) |
| Shriram Finance Ltd | Financial Services | 75.05 |
| Maruti Suzuki India Ltd | Consumer Discretionary | 55.43 |
| Eicher Motors Ltd | Consumer Discretionary | 53.62 |
| Bajaj Finance Ltd | Financial Services | 48.88 |
| Hindalco Industries Ltd | Commodities | 48.26 |
| SBI Life Insurance Company Ltd | Financial Services | 46.63 |
| Hero MotoCorp Ltd | Consumer Discretionary | 44.34 |
| Bharat Electronics Ltd | Industrials | 37.39 |
| Bharti Airtel Ltd | Telecommunication | 33.34 |
| Tata Steel Ltd | Commodities | 33.33 |
| Tata Consumer Products Ltd | Fast Moving Consumer Goods | 31.28 |
| Bajaj Finserv Ltd | Financial Services | 29.99 |
| Reliance Industries Ltd | Energy | 29.62 |
| JSW Steel Ltd | Commodities | 29.55 |
| State Bank of India | Financial Services | 25.87 |
Source: NSE
Bottom performers over a 1 Year Horizon:
Over the past year, the bottom performers included Trent Ltd, Tata Consultancy Services Ltd, and HCL Technologies Ltd with returns of -39.92%, -18.98%, and -13.9% respectively. These stocks were primarily from the Consumer Discretionary and Information Technology sectors.
Table: Bottom-15
| Stock | Sector | % Change (1Y) |
| Trent Ltd | Consumer Discretionary | -39.92 |
| Tata Consultancy Services Ltd | Information Technology | -18.98 |
| HCL Technologies Ltd | Information Technology | -13.9 |
| ITC Ltd | Fast Moving Consumer Goods | -13.8 |
| Infosys Ltd | Information Technology | -11.66 |
| IndusInd Bank Ltd | Financial Services | -9.99 |
| Wipro Ltd | Information Technology | -9.34 |
| Power Grid Corporation of India Ltd | Utilities | -8.09 |
| Sun Pharmaceutical Industries Ltd | Healthcare | -7.98 |
| Dr Reddy’s Laboratories Ltd | Healthcare | -7.75 |
| Adani Enterprises Ltd | Commodities | -7.33 |
| Tech Mahindra Ltd | Information Technology | -4.06 |
| Apollo Hospitals Enterprise Ltd | Healthcare | -3.22 |
| Jio Financial Services Ltd | Financial Services | -1.1 |
| Cipla Ltd | Healthcare | -0.3 |
Source: NSE
Stocks Near 52 Week Highs:
As of the end of last month, nearly 22 stocks were within 5% of their 52-week highs. Around 34 stocks were within 10% of their 52-week highs, with Hindalco Industries Ltd, Titan Company Ltd, and Shriram Finance Ltd being the closest.
Table: Stocks within 10% of 52 Week High
| Stock | Sector | Last Close | 52 Week High | vs 52 Week High (%) |
| Hindalco Industries Ltd | Commodities | 886.7 | 886.7 | 0.0 |
| Titan Company Ltd | Consumer Discretionary | 4051.5 | 4051.5 | 0.0 |
| Shriram Finance Ltd | Financial Services | 996.2 | 996.2 | 0.0 |
| Maruti Suzuki India Ltd | Consumer Discretionary | 16697.0 | 16703.0 | -0.04 |
| SBI Life Insurance Company Ltd | Financial Services | 2034.9 | 2036.0 | -0.05 |
| Eicher Motors Ltd | Consumer Discretionary | 7312.5 | 7324.0 | -0.16 |
| Nestle India Ltd | Fast Moving Consumer Goods | 1287.0 | 1289.0 | -0.16 |
| State Bank of India | Financial Services | 982.2 | 983.9 | -0.17 |
| Larsen Toubro Ltd | Industrials | 4083.5 | 4092.3 | -0.22 |
| Reliance Industries Ltd | Energy | 1570.4 | 1575.4 | -0.32 |
| Tata Consumer Products Ltd | Fast Moving Consumer Goods | 1192.0 | 1197.5 | -0.46 |
| Coal India Ltd | Energy | 399.0 | 402.35 | -0.83 |
| Bajaj Auto Ltd | Consumer Discretionary | 9350.0 | 9455.0 | -1.11 |
| Mahindra Mahindra Ltd | Consumer Discretionary | 3709.2 | 3757.3 | -1.28 |
| Axis Bank Ltd | Financial Services | 1269.4 | 1290.2 | -1.61 |
| HDFC Bank Ltd | Financial Services | 992.9 | 1012.95 | -1.98 |
| Kotak Mahindra Bank Ltd | Financial Services | 2203.0 | 2262.3939 | -2.63 |
| Bharti Airtel Ltd | Telecommunication | 2107.0 | 2165.0 | -2.68 |
| Tata Steel Ltd | Commodities | 179.93 | 185.0 | -2.74 |
| JSW Steel Ltd | Commodities | 1164.8 | 1210.0 | -3.74 |
| Adani Ports Special Economic Zone Ltd | Services | 1469.8 | 1530.5 | -3.97 |
| Grasim Industries Ltd | Commodities | 2829.0 | 2958.7 | -4.38 |
| Tech Mahindra Ltd | Information Technology | 1590.9 | 1678.3887 | -5.21 |
| Bajaj Finserv Ltd | Financial Services | 2039.9 | 2176.6 | -6.28 |
| Asian Paints Ltd | Consumer Discretionary | 2769.5 | 2968.5 | -6.7 |
| Oil Natural Gas Corpn Ltd | Energy | 240.38 | 258.3128 | -6.94 |
| Dr Reddy’s Laboratories Ltd | Healthcare | 1271.4 | 1366.3318 | -6.95 |
| Bharat Electronics Ltd | Industrials | 399.6 | 431.2495 | -7.34 |
| HDFC Life Insurance Company Ltd | Financial Services | 749.85 | 814.3 | -7.91 |
| Sun Pharmaceutical Industries Ltd | Healthcare | 1719.7 | 1872.4767 | -8.16 |
| UltraTech Cement Ltd | Commodities | 11792.0 | 12872.0 | -8.39 |
| NTPC Ltd | Utilities | 329.55 | 360.214 | -8.51 |
| ICICI Bank Ltd | Financial Services | 1342.9 | 1477.2018 | -9.09 |
| Hero MotoCorp Ltd | Consumer Discretionary | 5771.0 | 6350.5 | -9.13 |
| Cipla Ltd | Healthcare | 1511.3 | 1663.6 | -9.15 |
| Bajaj Finance Ltd | Financial Services | 986.5 | 1091.15 | -9.59 |
Source: NSE
Chart: Distribution of stocks vs their 52-week highs
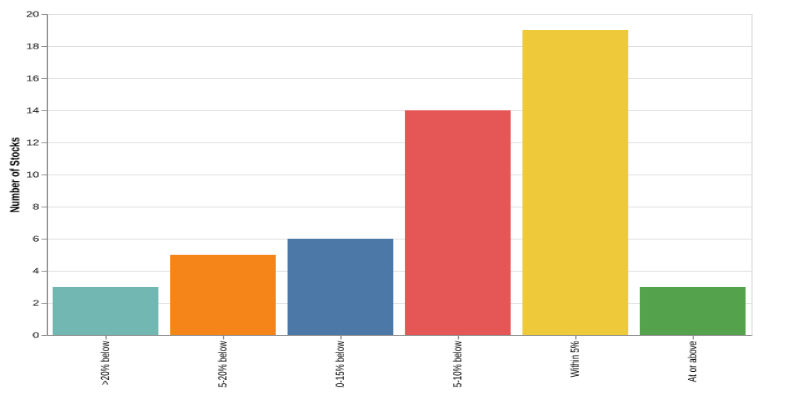
Source: NSE
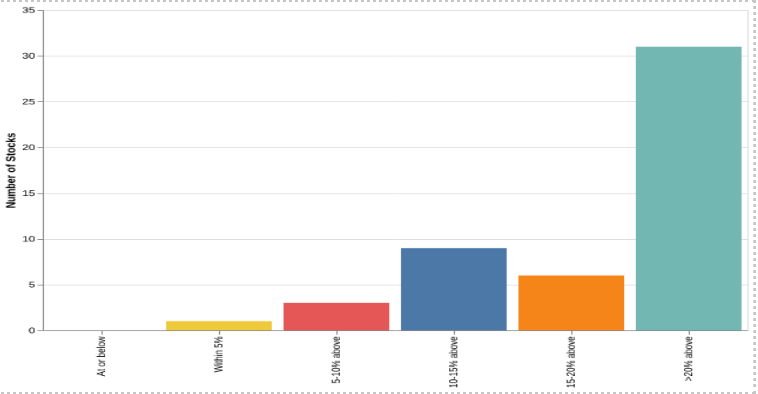
Stocks Near 52 Week Lows:
As of the end of last month, nearly 31 stocks were more than 20% away from their 52-week lows. Only 4 stocks were within 10% of their 52-week low, with ITC Ltd and Trent Ltd being the closest.
Table: Stocks within 10% of 52 Week Low
| Stock | Sector | Last Close | 52 Week Low | vs 52 Week Low |
| Tata Motors Passenger Vehicles Ltd | Consumer Discretionary | 367.35 | 343.4 | 6.97 |
| Hindustan Unilever Ltd | Fast Moving Consumer Goods | 2315.9 | 2118.2475 | 9.33 |
| ITC Ltd | Fast Moving Consumer Goods | 403.0 | 387.7065 | 3.94 |
| Trent Ltd | Consumer Discretionary | 4276.0 | 4018.3 | 6.41 |
Source: NSE
Chart: Distribution of stocks vs their 52 week Low
Source: NSE
Related Tags
![]() IIFL Customer Care Number
IIFL Customer Care Number
(Gold/NCD/NBFC/Insurance/NPS)
1860-267-3000 / 7039-050-000
![]() IIFL Capital Services Support WhatsApp Number
IIFL Capital Services Support WhatsApp Number
+91 9892691696
Download The App Now
Follow us on
2026, IIFL Capital Services Ltd. All Rights Reserved
IIFL Capital Services Limited - Stock Broker SEBI Regn. No: INZ000164132 (Member ID - NSE: 10975 BSE: 179 MCX: 55995 NCDEX: 01249), DP SEBI Reg. No. IN-DP-185-2016, PMS SEBI Regn. No: INP000002213, IA SEBI Regn. No: INA000000623, Merchant Banker SEBI Regn. No. INM000010940, RA SEBI Regn. No: INH000000248, BSE Enlistment Number (RA): 5016, AMFI-Registered Mutual Fund Distributor & SIF Distributor
ARN NO : 47791 (Date of initial registration – 17/02/2007; Current validity of ARN – 08/02/2027), PFRDA Reg. No. PoP 20092018, IRDAI Corporate Agent (Composite) : CA1099

This Certificate Demonstrates That IIFL As An Organization Has Defined And Put In Place Best-Practice Information Security Processes.


