
In December 2025, the Nifty Smallcap 100 index had a negative return of -0.65%. This was driven by weak performance in Consumer Discretionary, Utilities and Healthcare stocks. Commodities, on the other hand, posted a strong gain. The market breadth was negative with 43 stocks advancing and 55 declining.
Chart: Monthly Return Chart

Source: NSE
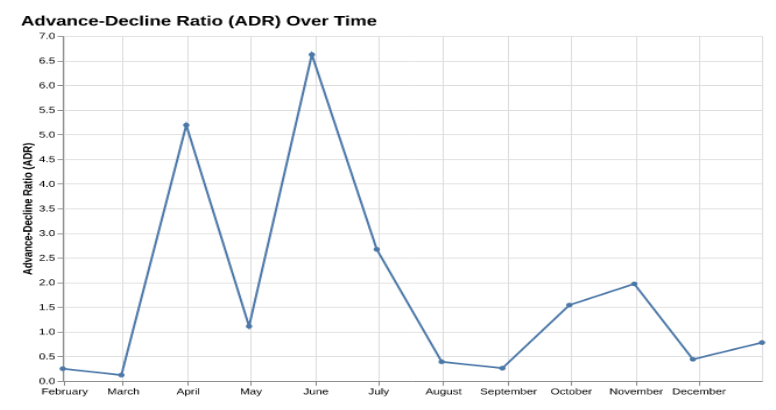
How was the market breadth: 43 advanced, while 55 declined:
In Dec-2025, the market breadth was slightly negative with 43 stocks advancing while 55 stocks declined. In comparison, this is mildly better than November, which saw weaker breadth with only 30 stocks advancing versus 68 declining.
Table: Advances and Declines history
| Month | Advances | Declines | Advance/Decline Ratio
close |
| Dec-2025 | 43 | 55 | 0.78 |
| Nov-2025 | 30 | 68 | 0.44 |
| Oct-2025 | 65 | 33 | 1.97 |
| Sep-2025 | 60 | 39 | 1.54 |
| Aug-2025 | 20 | 78 | 0.26 |
| Jul-2025 | 28 | 71 | 0.39 |
| Jun-2025 | 72 | 27 | 2.67 |
| May-2025 | 86 | 13 | 6.62 |
| Apr-2025 | 52 | 47 | 1.11 |
| Mar-2025 | 83 | 16 | 5.19 |
| Feb-2025 | 11 | 88 | 0.12 |
| Jan-2025 | 20 | 79 | 0.25 |
Source: NSE
Chart: Trends In ADR Ratio
Source: NSE
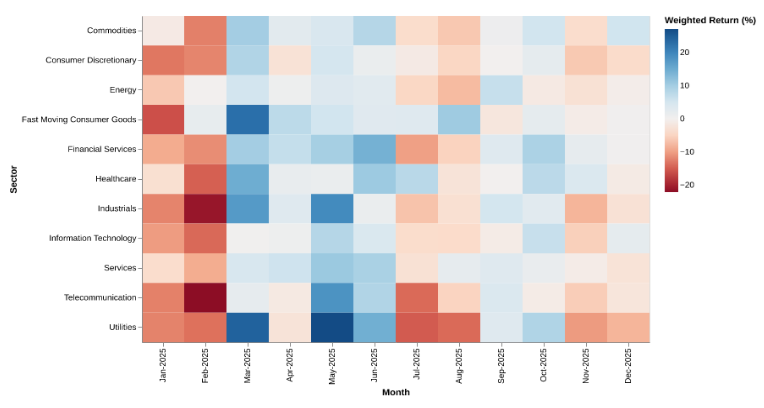
Commodities perform the best while Utilities perform the worst:
Commodities was the best-performing sector in the latest month with a weighted return of 5.5%. This was driven by strong performances from stocks like Hindustan Copper Ltd, Himadri Speciality Chemical Ltd, and Chambal Fertilisers & Chemicals Ltd. On the other hand, the worst-performing sector was Utilities, which saw a decline of 8.12%, with key contributors to this downturn including Reliance Power Ltd and CESC Ltd.
Table: Performance Across Sectors
| Sector | Number Of Stocks | % Change (w. avg) | % Change (avg) |
| Commodities | 10 | 5.5 | 6.95 |
| Information Technology | 8 | 2.21 | 1.88 |
| Financial Services | 18 | 0.38 | -0.21 |
| Fast Moving Consumer Goods | 2 | 0.33 | -0.55 |
| Energy | 4 | -0.65 | -1.14 |
| Healthcare | 7 | -1.21 | -3.25 |
| Telecommunication | 5 | -2.31 | -1.4 |
| Services | 5 | -2.71 | -1.42 |
| Industrials | 20 | -3.03 | -0.97 |
| Consumer Discretionary | 17 | -4.17 | -3.6 |
| Utilities | 2 | -8.12 | -7.24 |
Source: NSE
Chart: Sector Performance Heatmap Over the Past Year
Source: NSE
Top performers over a 1 Year Horizon:
Over the past year, the top performers were led by Hindustan Copper Ltd, Laurus Labs Ltd, and Navin Fluorine International Ltd with returns of 110.11%, 84.24%, and 82.85% respectively. These stocks were primarily from the Commodities and Healthcare sectors.
Table: Top-15
| Stock | Sector | % Change (1Y) |
| Hindustan Copper Ltd | Commodities | 110.11 |
| Laurus Labs Ltd | Healthcare | 84.24 |
| Navin Fluorine International Ltd | Commodities | 82.85 |
| Multi Commodity Exchange of India Ltd | Financial Services | 78.68 |
| Manappuram Finance Ltd | Financial Services | 65.21 |
| Godfrey Phillips India Ltd | Fast Moving Consumer Goods | 60.28 |
| Poonawalla Fincorp Ltd | Financial Services | 53.63 |
| Garden Reach Shipbuilders Engineers Ltd | Industrials | 52.74 |
| HBL Engineering Ltd | Industrials | 49.18 |
| Narayana Hrudayalaya Ltd | Healthcare | 49.0 |
| IIFL Finance Ltd | Financial Services | 47.64 |
| Karur Vysya Bank Ltd | Financial Services | 47.64 |
| CreditAccess Grameen Ltd | Financial Services | 43.66 |
| Redington Ltd | Services | 39.16 |
| IDBI Bank Ltd | Financial Services | 37.53 |
Source: NSE
Bottom performers over a 1 Year Horizon:
Over the past year, the bottom performers included Brainbees Solutions Ltd, Newgen Software Technologies Ltd, and Kaynes Technology India Ltd with returns of -56.0%, -50.1%, and -45.9% respectively. These stocks were primarily from the Consumer Discretionary and Industrials sectors.
Table: Bottom-15
| Stock | Sector | % Change (1Y) |
| Brainbees Solutions Ltd | Consumer Discretionary | -56.0 |
| Newgen Software Technologies Ltd | Information Technology | -50.1 |
| Kaynes Technology India Ltd | Industrials | -45.9 |
| Tejas Networks Ltd | Telecommunication | -45.22 |
| Zen Technologies Ltd | Industrials | -43.97 |
| Ramkrishna Forgings Ltd | Consumer Discretionary | -41.37 |
| PG Electroplast Ltd | Consumer Discretionary | -41.31 |
| NCC Ltd | Industrials | -40.84 |
| HFCL Ltd | Telecommunication | -39.81 |
| Sonata Software Ltd | Information Technology | -39.02 |
| International Gemmological Institute (India) Ltd | Services | -38.69 |
| KEC International Ltd | Industrials | -38.06 |
| Cyient Ltd | Information Technology | -37.95 |
| Action Construction Equipment Ltd | Industrials | -37.07 |
| Anant Raj Ltd | Consumer Discretionary | -35.94 |
Source: NSE
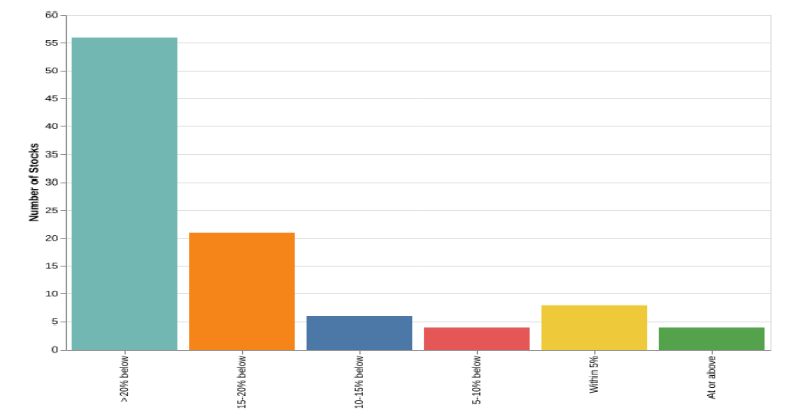
Stocks Near 52 Week Highs:
As of the end of last month, nearly 56 stocks were trading more than 20% below their 52-week highs. Only 16 stocks were within 10% of their 52-week highs, with Multi Commodity Exchange of India Ltd, Karur Vysya Bank Ltd and IIFL Finance Ltd being the closest.
Table: Stocks within 10% of 52 Week High
| Stock | Sector | Last Close | 52 Week High | vs 52 Week High (%) |
| Multi Commodity Exchange of India Ltd | Financial Services | 11125.0 | 11125.0 | 0.0 |
| Karur Vysya Bank Ltd | Financial Services | 263.83 | 263.83 | 0.0 |
| IIFL Finance Ltd | Financial Services | 610.5 | 610.5 | 0.0 |
| Laurus Labs Ltd | Healthcare | 1108.0 | 1108.0 | 0.0 |
| IDBI Bank Ltd | Financial Services | 102.99 | 104.62 | -1.56 |
| Manappuram Finance Ltd | Financial Services | 308.55 | 314.55 | -1.91 |
| Great Eastern Shipping Company Ltd | Services | 1129.0 | 1151.8 | -1.98 |
| Hindustan Copper Ltd | Commodities | 518.3 | 533.35 | -2.82 |
| Radico Khaitan Ltd | Fast Moving Consumer Goods | 3295.0 | 3400.0 | -3.09 |
| Navin Fluorine International Ltd | Commodities | 5920.0 | 6144.0 | -3.65 |
| Sagility Ltd | Information Technology | 52.02 | 54.5262 | -4.6 |
| NBCC (India) Ltd | Industrials | 121.77 | 127.8822 | -4.78 |
| Nuvama Wealth Management Ltd | Financial Services | 1480.5 | 1579.82 | -6.29 |
| Go Digit General Insurance Ltd | Financial Services | 344.6 | 372.35 | -7.45 |
| CESC Ltd | Utilities | 167.56 | 182.05 | -7.96 |
| Kalpataru Projects International Ltd | Industrials | 1202.4 | 1314.5 | -8.53 |
Source: NSE
Chart: Distribution of stocks vs their 52-week highs
Source: NSE
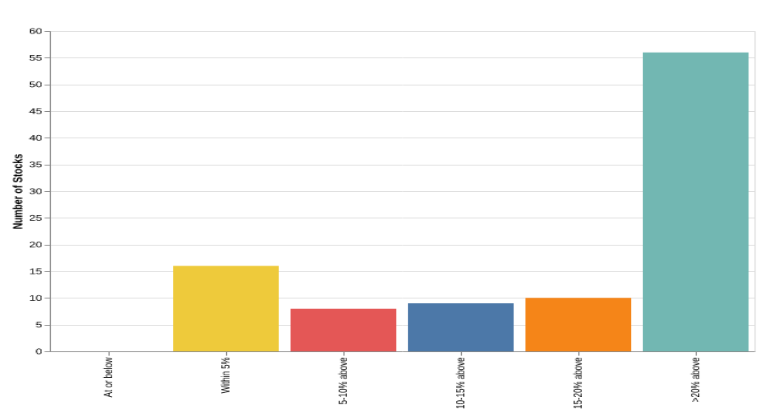
Stocks Near 52 Week Lows:
As of the end of last month, nearly 56 stocks were more than 20% above their 52-week lows. Only 16 stocks were within 5% of their 52-week lows, with Tejas Networks Ltd, Bata India Ltd, and Crompton Greaves Consumer Electricals Ltd being the closest.
Table: Stocks within 10% of 52 Week Low
| Stock | Sector | Last Close | 52 Week Low | vs 52 Week Low |
| Aarti Industries Ltd | Commodities | 373.9 | 349.7 | 6.92 |
| Amara Raja Energy Mobility Ltd | Consumer Discretionary | 909.85 | 895.95 | 1.55 |
| Mahanagar Gas Ltd | Energy | 1136.1 | 1105.6 | 2.76 |
| Tata Chemicals Ltd | Commodities | 765.55 | 748.4 | 2.29 |
| Afcons Infrastructure Ltd | Industrials | 386.9 | 379.45 | 1.96 |
| Brigade Enterprises Ltd | Consumer Discretionary | 885.0 | 855.95 | 3.39 |
| Piramal Pharma Ltd | Healthcare | 172.21 | 166.52 | 3.42 |
| PCBL Chemical Ltd | Commodities | 301.95 | 285.0 | 5.95 |
| Aditya Birla Real Estate Ltd | Commodities | 1674.8 | 1568.7 | 6.76 |
| Bata India Ltd | Consumer Discretionary | 943.0 | 938.05 | 0.53 |
| Five-Star Business Finance Ltd | Financial Services | 545.35 | 510.25 | 6.88 |
| Crompton Greaves Consumer Electricals Ltd | Consumer Discretionary | 252.25 | 249.15 | 1.24 |
| Indian Energy Exchange Ltd | Financial Services | 134.16 | 132.14 | 1.53 |
| Inox Wind Ltd | Industrials | 123.53 | 119.8 | 3.11 |
| Action Construction Equipment Ltd | Industrials | 946.65 | 923.9 | 2.46 |
| Tata Teleservices (Maharashtra) Ltd | Telecommunication | 49.57 | 45.65 | 8.59 |
| Cyient Ltd | Information Technology | 1118.0 | 1101.5 | 1.5 |
| NCC Ltd | Industrials | 160.44 | 153.07 | 4.81 |
| Tejas Networks Ltd | Telecommunication | 449.65 | 447.5 | 0.48 |
| Ramkrishna Forgings Ltd | Consumer Discretionary | 523.15 | 477.95 | 9.46 |
| Kaynes Technology India Ltd | Industrials | 4013.0 | 3807.0 | 5.41 |
| Reliance Power Ltd | Utilities | 34.85 | 32.92 | 5.86 |
| Newgen Software Technologies Ltd | Information Technology | 845.1 | 818.15 | 3.29 |
| Brainbees Solutions Ltd | Consumer Discretionary | 286.9 | 279.95 | 2.48 |
Source: NSE
Chart: Distribution of stocks vs their 52 week Low
Source: NSE
Related Tags
![]() IIFL Customer Care Number
IIFL Customer Care Number
(Gold/NCD/NBFC/Insurance/NPS)
1860-267-3000 / 7039-050-000
![]() IIFL Capital Services Support WhatsApp Number
IIFL Capital Services Support WhatsApp Number
+91 9892691696
Download The App Now
Follow us on
2026, IIFL Capital Services Ltd. All Rights Reserved
IIFL Capital Services Limited - Stock Broker SEBI Regn. No: INZ000164132 (Member ID - NSE: 10975 BSE: 179 MCX: 55995 NCDEX: 01249), DP SEBI Reg. No. IN-DP-185-2016, PMS SEBI Regn. No: INP000002213, IA SEBI Regn. No: INA000000623, Merchant Banker SEBI Regn. No. INM000010940, RA SEBI Regn. No: INH000000248, BSE Enlistment Number (RA): 5016, AMFI-Registered Mutual Fund Distributor & SIF Distributor
ARN NO : 47791 (Date of initial registration – 17/02/2007; Current validity of ARN – 08/02/2027), PFRDA Reg. No. PoP 20092018, IRDAI Corporate Agent (Composite) : CA1099

This Certificate Demonstrates That IIFL As An Organization Has Defined And Put In Place Best-Practice Information Security Processes.


