

As the earnings season picked up pace, the market witnessed a choppy week. After a sharp sell-off in the prior week, it stabilised and eked out a marginal gain of 0.04%. However, the stability was almost entirely due to two sectors – IT and banking. NIFTY BANK rebounded with a 1.42% gain, supported by strength in PSU and select private banks. On strong earnings, IT stocks rallied. NIFTY IT outperformed with a sharp 2.79% rise, snapping its three-week losing streak, driven by gains in heavyweight IT stocks.
Most of the other sectors witnessed a weak performance. NIFTY ENERGY slipped 0.18%, signalling a consolidation after last week’s sharp correction, while NIFTY FMCG declined 0.56%, extending its ongoing losing streak. NIFTY AUTO fell 1.75%, remaining under pressure, NIFTY PHARMA dropped 2.39% amid broad-based weakness in pharma heavyweights, and NIFTY REALTY slid 2.40%, continuing its recent downtrend.
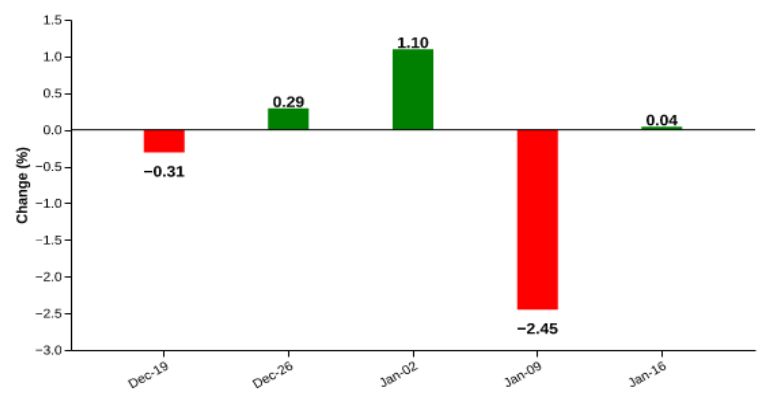
NIFTY 50 – Flat Week Supported By IT and Banking
Weekly Performance: 0.0%
| date | open | high | low | close |
| 2026-01-09 | 25840.4 | 25940.6 | 25623.0 | 25683.3 |
| 2026-01-12 | 25669.0 | 25813.2 | 25473.4 | 25790.2 |
| 2026-01-13 | 25897.3 | 25899.8 | 25603.3 | 25732.3 |
| 2026-01-14 | 25648.5 | 25791.8 | 25604.0 | 25665.6 |
| 2026-01-16 | 25696.0 | 25873.5 | 25662.4 | 25694.3 |
Source: NSE
Figure: Recent performance
Source: NSE
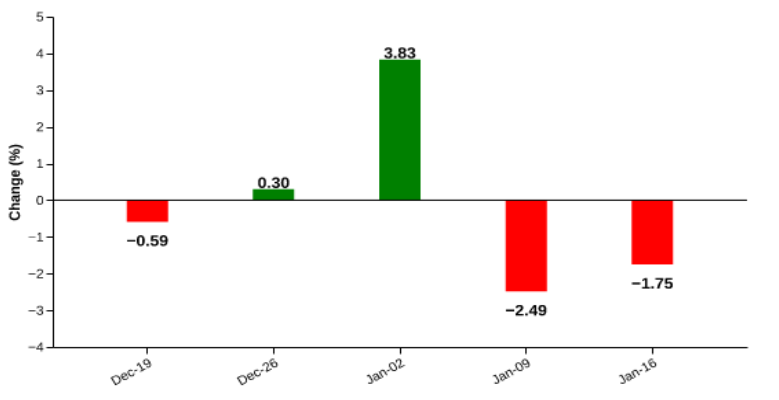
The NIFTY 50 ended with a flat 0.04% gain in the week ended 16 January 2026, after a sharp 2.45% decline seen in the previous week, signalling a tentative stabilisation. Gains were led by Infosys (+4.7%), State Bank of India (+4.2%), Tata Steel, Axis Bank and Tech Mahindra, which together supported the index’s upside. However, the advance was largely offset by corrections in HDFC Bank, Reliance Industries, ITC and Larsen & Toubro, which collectively capped the index’s gains. Strong earnings from Infosys set the tone for IT stocks while banking stocks approached their all-time highs. Market breadth remained weak, with 23 stocks advancing against 26 declining.
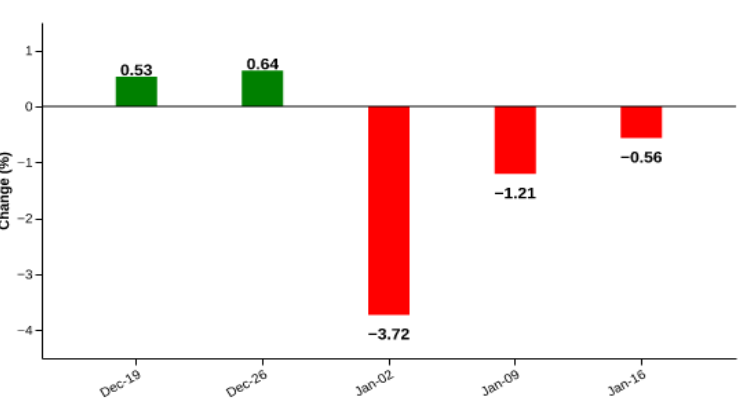
NIFTY MIDCAP SELECT – Slight Rebound Halts Recent Slide
Weekly Performance: 0.2%
| date | open | high | low | close |
| 2026-01-09 | 13775.8 | 13843.5 | 13619.1 | 13676.7 |
| 2026-01-12 | 13681.4 | 13721.9 | 13491.6 | 13697.0 |
| 2026-01-13 | 13750.8 | 13775.6 | 13529.6 | 13649.2 |
| 2026-01-14 | 13624.8 | 13742.6 | 13590.8 | 13705.9 |
| 2026-01-16 | 13727.5 | 13844.8 | 13657.9 | 13697.9 |
Source: NSE
Figure: Recent performance

Source: NSE
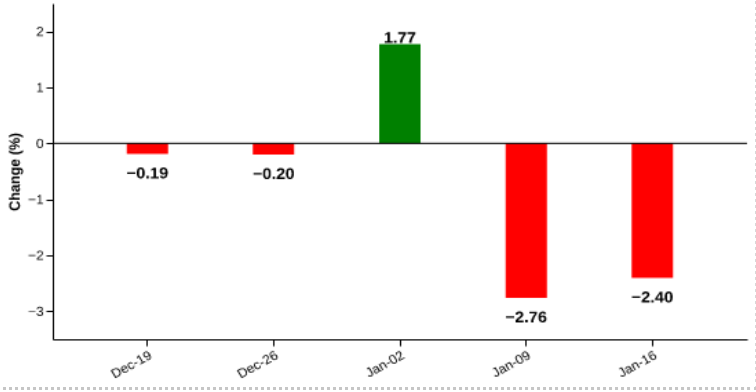
The NIFTY MIDCAP SELECT edged up marginally by 0.15% in the week ended 16 January 2026, snapping the sharp decline in the previous week. The positive momentum was supported by BSE Ltd (+5.2%), Coforge (+3.2%), HDFC Asset Management Company (+2.9%), Yes Bank (+2.7%) and Max Healthcare (+1.9%), which together supported the index’s upside. However, the advance was capped by a sharp ~10% fall in Dixon Technologies, along with weakness in PolicyBazaar (-4.2%), Polycab (-7.3%), Godrej Properties (-5.1%) and Voltas (-4.0%), which weighed on overall performance. Market breadth remained positive, with 13 stocks advancing against 12 declining.
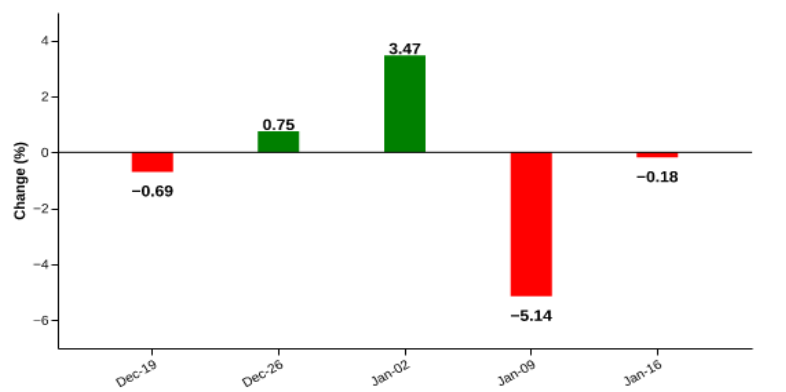
NIFTY IT – Earnings Surprises Lead To A Strong Rally
Weekly Performance: 2.8%
| date | open | high | low | close |
| 2026-01-09 | 37861.2 | 38244.6 | 37861.1 | 38027.2 |
| 2026-01-12 | 37938.6 | 38079.6 | 37573.1 | 37988.2 |
| 2026-01-13 | 38227.9 | 38394.4 | 37777.8 | 38236.6 |
| 2026-01-14 | 38127.2 | 38295.8 | 37649.1 | 37822.7 |
| 2026-01-16 | 38433.4 | 39139.5 | 38390.5 | 39086.6 |
Source: NSE
Figure: Recent performance

Source: NSE
The NIFTY IT index gained 2.79% in the week ended 16 January 2026, ending its three-week losing streak and signalling a clear shift in the short-term trend. The upmove was driven by strong gains in Tech Mahindra (+5.58%), Infosys (+4.69%), L&T Infotech (+4.49%), Coforge (+3.20%) and HCL Technologies (+2.16%), which provided substantial support to the index. On the other hand, Persistent Systems (-0.16%) and Tata Consultancy Services (-0.03%) offered mild resistance, though their impact remained limited. Market breadth was positive, with 8 stocks advancing against 2 declining.
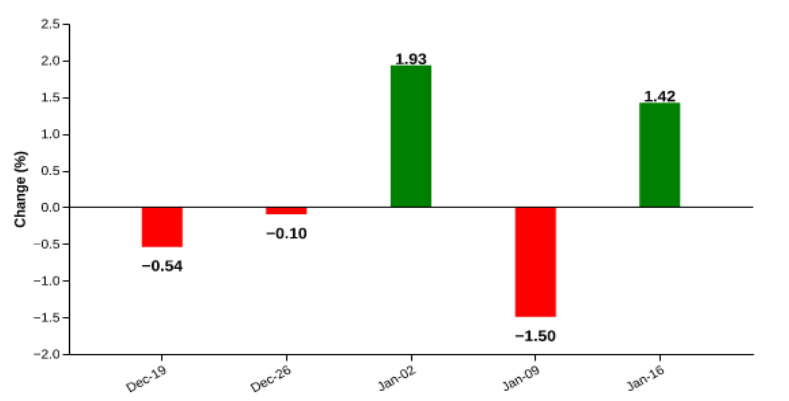
NIFTY BANK – Near All-Time Highs
Weekly Performance: 1.4%
| date | open | high | low | close |
| 2026-01-09 | 59558.1 | 59739.6 | 59154.2 | 59251.6 |
| 2026-01-12 | 59217.2 | 59541.1 | 58864.2 | 59450.5 |
| 2026-01-13 | 59767.6 | 59767.6 | 59312.1 | 59578.8 |
| 2026-01-14 | 59330.4 | 59796.6 | 59324.2 | 59580.1 |
| 2026-01-16 | 59590.4 | 60235.1 | 59510.5 | 60095.1 |
Source: NSE
Figure: Recent performance
Source: NSE
The NIFTY BANK index rose 1.42% in the week ended 16 January 2026, reversing the decline recorded in the previous week and signalling a recovery in banking stocks. The upmove was driven by strong gains in IndusInd Bank (+8.12%), Punjab National Bank (+7.70%), Federal Bank (+5.86%) and State Bank of India (+4.18%), which together provided significant support to the index. However, the advance was partly offset by a sharp fall in Kotak Mahindra Bank, along with weakness in HDFC Bank and IDFC First Bank, which capped the index’s upside. Market breadth remained positive, with 9 stocks advancing against 3 declining.
NIFTY ENERGY – A modest correction after a sharp fall in the prior week
Weekly Performance: -0.2%
| date | open | high | low | close |
| 2026-01-09 | 34736.4 | 34951.8 | 34284.2 | 34409.3 |
| 2026-01-12 | 34404.8 | 34517.9 | 33899.4 | 34473.6 |
| 2026-01-13 | 34630.0 | 34705.9 | 34177.9 | 34416.7 |
| 2026-01-14 | 34364.0 | 34811.8 | 34328.6 | 34622.2 |
| 2026-01-16 | 34614.4 | 34745.3 | 34246.9 | 34346.4 |
Source: NSE
Figure: Recent performance
Source: NSE
The NIFTY ENERGY index declined 0.18% in the week ended 16 January 2026, extending its weakness and indicating a pause rather than a clear reversal in trend. The weakness was driven by sharp losses in Gujarat State Power & Chemicals and Power India, along with continued pressure in CG Power (-5.78%), which together dragged the index lower. Gains in ONGC (+5.59%), Coal India and NTPC, along with strength in Oil India and BPCL, provided partial support but were insufficient to offset the broader pressure. Market breadth remained weak, with 13 stocks advancing and 27 declining.
NIFTY FMCG – ITC continues to be a drag
Weekly Performance: -0.6%
| date | open | high | low | close |
| 2026-01-09 | 52918.2 | 53083.5 | 52332.6 | 52438.1 |
| 2026-01-12 | 52381.2 | 52814.9 | 52271.8 | 52745.5 |
| 2026-01-13 | 52816.4 | 53007.1 | 52326.2 | 52577.1 |
| 2026-01-14 | 52608.8 | 52608.8 | 52162.4 | 52258.6 |
| 2026-01-16 | 52510.9 | 52601.4 | 52038.6 | 52142.5 |
Source: NSE
Figure: Recent performance
Source: NSE
The NIFTY FMCG index declined 0.56% in the week ended 16 January 2026, extending its three-week losing streak and indicating that the bearish trend remains intact. The decline was led by ITC (-2.36%), along with continued pressure from Hindustan Unilever, Patanjali, Britannia and Radico, collectively weighing on sector performance. On the positive side, gains in Vardhman Textiles, Nestlé India, Tata Consumer Products, Colgate-Palmolive and United Spirits provided partial support. Market breadth remained narrow, with 7 stocks advancing against 8 declining.
NIFTY AUTO – Index Slides as Maruti and Eicher Lead Downturn
Weekly Performance: -1.7%
| date | open | high | low | close |
| 2026-01-09 | 28380.0 | 28516.0 | 28034.8 | 28087.7 |
| 2026-01-12 | 28055.4 | 28165.6 | 27492.7 | 28011.8 |
| 2026-01-13 | 28154.3 | 28159.6 | 27694.6 | 27915.1 |
| 2026-01-14 | 27893.8 | 27932.3 | 27635.7 | 27721.8 |
| 2026-01-16 | 27642.4 | 27977.2 | 27516.2 | 27596.2 |
Source: NSE
Figure: Recent performance
Source: NSE
The NIFTY AUTO index slipped 1.75% in the week ended 16 January 2026, recording its second straight weekly decline and reinforcing the prevailing weak trend. Selling pressure was concentrated in key names such as Maruti Suzuki (-3.89%), Eicher Motors (-2.56%) and TVS Motor (-2.86%), with additional drag from TI India (-4.48%) and Mahindra & Mahindra, which together weighed heavily on the index. In contrast, Balkrishna Industries (+3.70%) and Bharat Forge (+0.89%) posted modest gains, though their impact was limited amid broad-based weakness. Market breadth stayed poor, with just 2 stocks advancing against 12 declining.
NIFTY PHARMA – Sharp Weekly Decline Led by Heavyweight Pressure
Weekly Performance: -2.4%
| date | open | high | low | close |
| 2026-01-09 | 22961.1 | 22989.8 | 22696.4 | 22761.0 |
| 2026-01-12 | 22758.0 | 22769.8 | 22392.5 | 22668.4 |
| 2026-01-13 | 22708.1 | 22742.7 | 22392.2 | 22562.3 |
| 2026-01-14 | 22571.1 | 22580.8 | 22413.9 | 22505.4 |
| 2026-01-16 | 22456.6 | 22484.3 | 22175.2 | 22217.1 |
Source: NSE
Figure: Recent performance

Source: NSE
The NIFTY PHARMA index declined 2.39% in the week ended 16 January 2026, deepening the ongoing downtrend after a phase of subdued and mixed weekly performance. The weakness was driven by sharp losses in Sun Pharma (-3.53%) and Divi’s Laboratories (-5.75%), along with continued pressure from Cipla, Dr. Reddy’s Laboratories and Ipca Laboratories, which together exerted significant drag on the index. Selective gains in Torrent Pharma, Gland Pharma, Alkem Laboratories and JB Chemicals & Pharmaceuticals failed to offset the broad-based sell-off. Market breadth remained weak, with 4 advances against 16 declines.
NIFTY REALTY – Index Slides Further as Realty Majors Weigh
Weekly Performance: -2.4%
| date | open | high | low | close |
| 2026-01-09 | 891.8 | 893.1 | 869.0 | 874.0 |
| 2026-01-12 | 874.2 | 878.4 | 852.1 | 863.3 |
| 2026-01-13 | 865.1 | 871.1 | 848.2 | 858.0 |
| 2026-01-14 | 854.6 | 855.8 | 843.6 | 850.0 |
| 2026-01-16 | 853.0 | 867.6 | 847.7 | 853.0 |
Source: NSE
Figure: Recent performance
Source: NSE
The NIFTY REALTY index declined 2.40% in the week ended 16 January 2026, extending its recent downtrend and marking the second consecutive weekly loss, signalling sustained bearish momentum in the sector. The weakness was led by sharp declines in Godrej Properties (-5.15%) and DLF (-3.14%), along with continued pressure from Oberoi Realty, Sobha and Prestige, which together dragged the index lower. On the positive side, Lodha Group (+0.90%) and Anant Raj offered marginal support, though their contribution was limited amid broad-based selling. Market breadth remained weak, with 2 stocks advancing against 8 declining.
Related Tags
![]() IIFL Customer Care Number
IIFL Customer Care Number
(Gold/NCD/NBFC/Insurance/NPS)
1860-267-3000 / 7039-050-000
![]() IIFL Capital Services Support WhatsApp Number
IIFL Capital Services Support WhatsApp Number
+91 9892691696
Download The App Now
Follow us on
2026, IIFL Capital Services Ltd. All Rights Reserved
IIFL Capital Services Limited - Stock Broker SEBI Regn. No: INZ000164132 (Member ID - NSE: 10975 BSE: 179 MCX: 55995 NCDEX: 01249), DP SEBI Reg. No. IN-DP-185-2016, PMS SEBI Regn. No: INP000002213, IA SEBI Regn. No: INA000000623, Merchant Banker SEBI Regn. No. INM000010940, RA SEBI Regn. No: INH000000248, BSE Enlistment Number (RA): 5016, AMFI-Registered Mutual Fund Distributor & SIF Distributor
ARN NO : 47791 (Date of initial registration – 17/02/2007; Current validity of ARN – 08/02/2027), PFRDA Reg. No. PoP 20092018, IRDAI Corporate Agent (Composite) : CA1099

This Certificate Demonstrates That IIFL As An Organization Has Defined And Put In Place Best-Practice Information Security Processes.


