No Record Found
No Record Found
Sector
Power Generation & DistributionOpen
₹421Prev. Close
₹421.9Turnover(Lac.)
₹2,377.02Day's High
₹421.05Day's Low
₹41052 Week's High
₹56352 Week's Low
₹336Book Value
₹114.67Face Value
₹5Mkt Cap (₹ Cr.)
8,131.44P/E
23.62EPS
17.84Divi. Yield
0.191 Sep 2025
12:00 AM
AGM
Announcement Date: 01 Sep, 2025
20 Dec 2024
12:00 AM
Bonus
16 Jan 2026
12:00 AM
Board Meeting
Agenda : Audited Result
21 Jan 2026
12:00 AM
Dividend
Dividend Amount: 0.2
Record Date: 28 Jan, 2026
17 Dec 2025
12:00 AM
EGM
22 May 2024
12:00 AM
Split
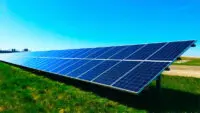
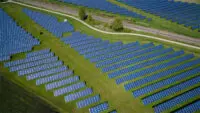
As per the terms of agreement, the proposed projects will include the development of renewable energy capacity across various locations in Gujarat.
Under the terms of agreement, KPI Green Energy will be responsible for technical and commercial development activities.

Here are some of the stocks that may see significant price movement today: GMR Power, Titagarh Rail, KPI Green Energy, etc.
The e-voting window through CDSL will open at 9 am on January 13, 2026, and close at 5 pm on January 15, 2026.
KPI will also supply steel structures for solar mounting systems and provide long term operation and maintenance services.

| Y/e 31 Mar( In .Cr) | Mar-2025 | Mar-2024 | Mar-2023 | Mar-2022 |
|---|---|---|---|---|
Equity Capital | 98.45 | 60.28 | 36.13 | 18.07 |
Preference Capital | 0 | 0 | 0 | 0 |
Reserves | 1,898.41 | 687.97 | 192.17 | 137.29 |
Net Worth | 1,996.86 | 748.25 | 228.3 | 155.36 |
Minority Interest |
| Y/e 31 Mar( In .Cr) | Mar-2021 | Mar-2020 | Mar-2019 | Mar-2018 |
|---|---|---|---|---|
Revenue | 103.5 | 59.28 | 34.5 | 31.55 |
yoy growth (%) | 74.59 | 71.79 | 9.35 | 22.49 |
Raw materials | -24.51 | -17.4 | -10.69 | -5.49 |
As % of sales | 23.68 | 29.36 | 30.98 | 17.42 |
Employee costs | -1.76 | -1.61 | -0.86 | -0.86 |
| Y/e 31 Mar( In .Cr) | Mar-2021 | Mar-2020 | Mar-2019 | Mar-2018 |
|---|---|---|---|---|
Profit before tax | 30.35 | 12.06 | 7.07 | 7.59 |
Depreciation | -12.52 | -7.48 | -4.47 | -8.07 |
Tax paid | -8.12 | -5.49 | -3.92 | -0.14 |
Working capital | 55.14 | -8.01 | 27.77 | 12.33 |
Other operating items |
| Y/e 31 Mar | Mar-2021 | Mar-2020 | Mar-2019 | Mar-2018 |
|---|---|---|---|---|
Growth matrix (%) | ||||
Revenue growth | 74.59 | 71.79 | 9.35 | 22.49 |
Op profit growth | 116.06 | 77.09 | -17.67 | 6.53 |
EBIT growth | 133.7 | 81.69 | 3.66 | -32.25 |
Net profit growth | 240.4 | -27.03 | 20.4 | -8.99 |
| Particulars (Rupees in Crores.) | Mar-2025 | Mar-2024 | Mar-2023 | Mar-2022 | Mar-2021 |
|---|---|---|---|---|---|
Gross Sales | 1,735.45 | 1,023.9 | 643.79 | 229.94 | 103.5 |
Excise Duty | 0 | 0 | 0 | 0 | 0 |
Net Sales | 1,735.45 | 1,023.9 | 643.79 | 229.94 | 103.5 |
Other Operating Income | 0 | 0 | 0 | 0 | 0 |
Other Income | 19.7 | 6.92 | 3.25 | 1.58 | 0.44 |
Company Name | LTP (₹) | P/E (%) | Mkt.Cap (₹Cr.) | NP Qtr (₹Cr.) | Div.Yield (%) | Sales Qtr (₹.Cr) | Book Value (₹) |
|---|---|---|---|---|---|---|---|
NTPC Ltd NTPC | 368.45 | 17.7 | 3,57,273.66 | 4,986.94 | 2.27 | 40,643.79 | 173.1 |
Adani Power Ltd ADANIPOWER | 150.91 | 28.36 | 2,90,909.62 | 2,046.82 | 0 | 10,011.2 | 24.82 |
Power Grid Corporation of India Ltd POWERGRID | 294.45 | 17.44 | 2,73,902.78 | 4,160.17 | 3.06 | 11,005.28 | 105.9 |
Adani Green Energy Ltd ADANIGREEN | 994.75 | 222.01 | 1,63,828.14 | 82 | 0 | 3,257 | 89.82 |
Adani Energy Solutions Ltd ADANIENSOL | 1,033.8 | 218.07 | 1,24,170.58 | 114.21 | 0 | 640.48 | 166.9 |
Figures of Market Capital(Mar Cap), Quarterly Net Profit(NP Qtr) and Quarterly Sales(Sales Qtr) are in ₹ Cr.
Chairman / Executive Director / M D / Promoter
Farukbhai Patel
Non-Exec & Non-Independent Dir
Bhadrabala Joshi
E D & Wholetime Director
Mohmed Sohil Yusufbhai Dabhoya
Independent Non Exe. Director
Shanker Baheria
Independent Non Exe. Director
Sharadchandra Babhutabhai Patil
Independent Non Exe. Director
Satya Gopal
Independent Non Exe. Director
Venu Birappa
Non-Exec & Non-Independent Dir
Amitkumar Subhashchandra Khandelwal
Independent Non Exe. Director
TEJPALSINGH BISHT JAGATSINGH
Independent Non Exe. Director
Mohamed Hanif M Habib Dalchawal
Company Sec. & Compli. Officer
Rajvi Upadhyay
Shop No A-1/2 Fidros Tower,
Near Fazal Tower Adajan Patia,
Gujarat - 395009
Tel: 91-261-2764757
Website: http://www.kpigreenenergy.com
Email: info@kpgroup.co
Office No S6-2,
Pinnacle Busine.Park, Mahakali Caves Road,
Mumbai - 400093
Tel: 91-22-62638200
Website: www.bigshareonline.com
Email: investor@bigshareonline.com / info@bigshareonline.com
Summary
KPI Green Energy Limited was formerly incorporated as KPI Global Infrastructure Limited on February 01, 2008 in Mumbai. The Company obtained Certificate of Commencement of Business on August 22, 2008....
Read More
Reports by KPI Green Energy Ltd
What is the KPI Green Energy Ltd share price today?
What is the Market Cap of KPI Green Energy Ltd?
What is the PE and PB ratio of KPI Green Energy Ltd?
What is the 52 Week High and Low of KPI Green Energy Ltd?
What is the CAGR of KPI Green Energy Ltd?
What is the shareholding pattern of KPI Green Energy Ltd?
![]() IIFL Customer Care Number
IIFL Customer Care Number
(Gold/NCD/NBFC/Insurance/NPS)
1860-267-3000 / 7039-050-000
![]() IIFL Capital Services Support WhatsApp Number
IIFL Capital Services Support WhatsApp Number
+91 9892691696
Download The App Now
Follow us on
2026, IIFL Capital Services Ltd. All Rights Reserved
IIFL Capital Services Limited - Stock Broker SEBI Regn. No: INZ000164132, PMS SEBI Regn. No: INP000002213,IA SEBI Regn. No: INA000000623, SEBI RA Regn. No: INH000000248, DP SEBI Reg. No. IN-DP-185-2016, BSE Enlistment Number (RA): 5016
ARN NO : 47791 (AMFI Registered Mutual Fund & Specialized Investment Fund Distributor), PFRDA Reg. No. PoP 20092018

This Certificate Demonstrates That IIFL As An Organization Has Defined And Put In Place Best-Practice Information Security Processes.