
FPI flows posted a net inflow of INR 80.95 billion over the 15-day period ending February 28, 2026, with breadth favouring inflows across 13 of 24 sectors. Leadership was concentrated, as Financial Services, Sovereign, and Capital Goods drove the bulk of the buying with combined inflows of INR 129.75 billion. Conversely, Information Technology saw the largest single-sector outflow at INR 59.93 billion, followed by Consumer Services at INR 52.38 billion and Realty at INR 28.14 billion. Together, these three laggards accounted for outflows of INR 140.45 billion, creating a clear two-tier market where heavy rotation into domestic cyclicals balanced the exit from IT stocks.
Financials Lead Inflows as Tech Outflows Accelerate Sharply
Financial Services dominated inflows with INR 47.57 billion. Capital Goods and Sovereign sectors followed with INR 41.03 billion and INR 41.15 billion, respectively. Automobiles saw inflows of INR 30.75 billion. The outflows were severe and concentrated. Information Technology led redemptions at INR -59.93 billion, a -0.08% AUM impact. Consumer Services and Realty saw outflows of INR -52.38 billion and INR -28.14 billion.
Flow momentum shifted sharply versus the prior 15-day window. Financial Services inflows decelerated by INR 46.04 billion. Conversely, Information Technology outflows accelerated by INR 49.63 billion. Automobile inflows increased by INR 25.64 billion. The top three inflow sectors captured INR 129.75 billion, while the top three outflows totalled INR -140.45 billion. This indicates positive sectoral breadth, as inflows were spread across more sectors while outflows were concentrated in a few large sectors.
Figure: Market Snapshot
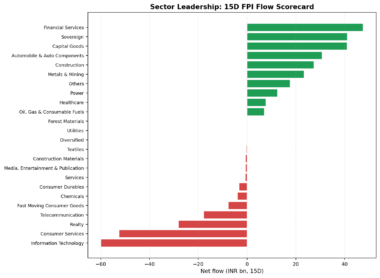
Table: FPI Sector Flows (15-Day)
|
Sector |
15D Flow (INR bn) |
Flow (% Total AUM) |
Sector AUM (INR bn) |
AUM Share (%) |
Change vs Prev 15D (INR bn) |
|
Financial Services |
47.57 |
0.06 |
23,569.61 |
29.83 |
-46.04 |
|
Automobile & Auto |
30.75 |
0.04 |
5,648.47 |
7.15 |
25.64 |
|
Oil, Gas & |
7.03 |
0.01 |
5,377.30 |
6.80 |
-39.72 |
|
Healthcare |
7.72 |
0.01 |
4,754.31 |
6.02 |
22.43 |
|
Capital Goods |
41.03 |
0.05 |
4,639.96 |
5.87 |
-39.29 |
|
Information |
-59.93 |
-0.08 |
4,179.93 |
5.29 |
49.63 |
|
Telecommunication |
-17.75 |
-0.02 |
3,838.47 |
4.86 |
-16.69 |
|
Sovereign |
41.15 |
0.05 |
3,518.61 |
4.45 |
-13.13 |
|
Fast Moving Consumer |
-7.69 |
-0.01 |
3,347.67 |
4.24 |
4.13 |
|
Others |
17.64 |
0.02 |
3,170.89 |
4.01 |
-27.69 |
|
Metals & Mining |
23.38 |
0.03 |
2,833.91 |
3.59 |
-9.62 |
|
Power |
12.45 |
0.02 |
2,543.67 |
3.22 |
-10.70 |
|
Consumer Services |
-52.38 |
-0.07 |
2,506.02 |
3.17 |
-62.94 |
|
Consumer Durables |
-3.22 |
-0.00 |
1,779.10 |
2.25 |
1.12 |
|
Services |
-0.74 |
-0.00 |
1,705.14 |
2.16 |
-13.22 |
|
Construction |
27.42 |
0.04 |
1,427.69 |
1.81 |
9.22 |
|
Realty |
-28.14 |
-0.04 |
1,410.01 |
1.78 |
-32.91 |
|
Chemicals |
-3.94 |
-0.01 |
1,214.79 |
1.54 |
-10.36 |
|
Construction |
-0.57 |
-0.00 |
1,182.18 |
1.50 |
-4.35 |
|
Textiles |
-0.33 |
-0.00 |
181.24 |
0.23 |
0.34 |
|
Media, Entertainment |
-0.62 |
-0.00 |
105.92 |
0.13 |
-1.96 |
|
Diversified |
0.02 |
0.00 |
39.33 |
0.05 |
0.04 |
|
Forest Materials |
0.08 |
0.00 |
29.27 |
0.04 |
-0.22 |
|
Utilities |
0.02 |
0.00 |
18.96 |
0.02 |
0.16 |
Source: NSDL
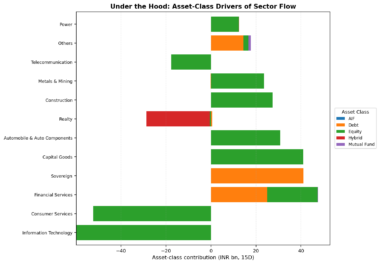
Equity Flows Highlight the Extreme Divergence
Equity flows dominated the 15-day period ending February 28, 2026, driving the largest sector inflows. Capital Goods led with an INR 41.03 bn inflow entirely from equity, while Automobiles added INR 30.75 bn. Financial Services, the largest sector by AUM at 29.83%, saw an INR 47.57 bn net inflow, but its primary driver was debt at INR 25.01 bn. Conversely, the major outflows were unequivocally equity-led. Information Technology saw an INR 59.93 bn outflow solely from equity, and Consumer Services lost INR 52.38 bn from the same asset class.
The regime was clearly equity-led for both positive and negative moves, with debt providing selective support. Two sectors exhibited internal asset-class offsets. In Metals & Mining, an INR 23.59 bn equity inflow was partially offset by an INR 0.21 bn debt outflow for an INR 23.38 bn net. In Services, an INR 2.05 bn equity gain was negated by an INR 2.72 bn debt outflow, resulting in a minor INR -0.74 bn net. Sovereign debt was a pure INR 41.15 bn inflow, but the broad market direction was set by equity.
Figure: Market Snapshot
Source: NSDL
Table: FPI Sector Flows by Asset Class (15-Day)
|
Sector |
Net Flow (INR bn) |
Top Positive Asset Class |
Top Positive Flow (INR bn) |
Top Negative Asset Class |
Top Negative Flow (INR bn) |
AUM Share (%) |
|
Financial Services |
47.57 |
Debt |
25.01 |
AIF |
0.00 |
29.83 |
|
Automobile & Auto |
30.75 |
Equity |
30.75 |
AIF |
0.00 |
7.15 |
|
Oil, Gas & |
7.03 |
Equity |
7.03 |
AIF |
0.00 |
6.80 |
|
Healthcare |
7.72 |
Equity |
7.22 |
AIF |
0.00 |
6.02 |
|
Capital Goods |
41.03 |
Equity |
41.03 |
AIF |
0.00 |
5.87 |
|
Information |
-59.93 |
AIF |
0.00 |
Equity |
-59.93 |
5.29 |
|
Telecommunication |
-17.75 |
AIF |
0.00 |
Equity |
-17.75 |
4.86 |
|
Sovereign |
41.15 |
Debt |
41.15 |
AIF |
0.00 |
4.45 |
|
Fast Moving Consumer |
-7.69 |
AIF |
0.00 |
Equity |
-7.69 |
4.24 |
|
Others |
17.64 |
Debt |
14.33 |
AIF |
0.00 |
4.01 |
|
Metals & Mining |
23.38 |
Equity |
23.59 |
Debt |
-0.21 |
3.59 |
|
Power |
12.45 |
Equity |
12.34 |
AIF |
0.00 |
3.22 |
|
Consumer Services |
-52.38 |
AIF |
0.00 |
Equity |
-52.38 |
3.17 |
|
Consumer Durables |
-3.22 |
AIF |
0.00 |
Equity |
-3.22 |
2.25 |
|
Services |
-0.74 |
Equity |
2.05 |
Debt |
-2.72 |
2.16 |
|
Construction |
27.42 |
Equity |
27.42 |
AIF |
0.00 |
1.81 |
|
Realty |
-28.14 |
Debt |
0.60 |
Hybrid |
-28.22 |
1.78 |
|
Chemicals |
-3.94 |
AIF |
0.00 |
Equity |
-3.94 |
1.54 |
|
Construction |
-0.57 |
AIF |
0.00 |
Equity |
-0.57 |
1.50 |
|
Textiles |
-0.33 |
AIF |
0.00 |
Equity |
-0.33 |
0.23 |
|
Media, Entertainment |
-0.62 |
AIF |
0.00 |
Equity |
-0.62 |
0.13 |
|
Diversified |
0.02 |
Equity |
0.02 |
AIF |
0.00 |
0.05 |
|
Forest Materials |
0.08 |
Equity |
0.08 |
AIF |
0.00 |
0.04 |
|
Utilities |
0.02 |
Equity |
0.08 |
Debt |
-0.06 |
0.02 |
Source: NSDL
Where FPIs Rotated: Rotation from Defensives to Cyclicals Gains Momentum
Sector flow rotation over the last twelve fortnights reveals a clear shift from defensives to cyclicals. Financial Services swung from an outflow of INR -85.51 bn in mid-December to a strong inflow of INR 93.61 bn in mid-February. Capital Goods saw a decisive turn, moving from INR -18.42 bn in late December to INR 80.32 bn in mid-February. Conversely, Information Technology saw persistent outflows, culminating in an INR -109.56 bn print in mid-February. Sovereign flows were volatile, ranging from INR -69.98 bn to INR 101.95 bn. Automobiles rebounded to INR 30.75 bn in late February from INR -30.94 bn in late January. Oil & Gas peaked at INR 80.43 bn in late October, while Healthcare remained negative for ten of twelve periods.
Three sectors show exceptional flow persistence. Fast-moving consumer goods endured relentless selling pressure for all twelve fortnights, averaging INR -23.77 bn. Textiles mirrored this trend with twelve consecutive negative prints, averaging INR -1.49 bn. In stark contrast, Metals & Mining was persistently bid, recording inflows in ten of twelve fortnights with an average of INR 20.37 bn and a latest print of INR 23.38 bn.
Figure: Market Snapshot
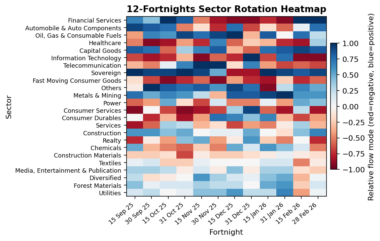
Table: FPI Sector Flows (Last 12 Fortnights)
|
Sector (INR bn) |
15 Sep 25 |
30 Sep 25 |
15 Oct 25 |
31 Oct 25 |
15 Nov 25 |
30 Nov 25 |
15 Dec 25 |
31 Dec 25 |
15 Jan 26 |
31 Jan 26 |
15 Feb 26 |
28 Feb 26 |
|
Financial Services |
10.39 |
3.28 |
85.46 |
53.81 |
-20.06 |
-15.26 |
-85.51 |
-73.42 |
-34.91 |
-56.27 |
93.61 |
47.57 |
|
Automobile & Auto |
19.08 |
17.33 |
15.60 |
-5.93 |
-3.85 |
-12.57 |
6.11 |
-26.56 |
-5.00 |
-30.94 |
5.11 |
30.75 |
|
Oil, Gas & |
-15.28 |
7.75 |
10.87 |
80.43 |
29.92 |
41.77 |
28.97 |
-6.46 |
4.85 |
-3.92 |
46.75 |
7.03 |
|
Healthcare |
-16.01 |
-45.21 |
-27.39 |
-3.55 |
-25.26 |
7.43 |
-23.51 |
-6.43 |
-10.66 |
-34.00 |
-14.71 |
7.72 |
|
Capital Goods |
15.18 |
14.84 |
-8.75 |
1.69 |
7.82 |
17.07 |
-12.24 |
-18.42 |
3.26 |
24.35 |
80.32 |
41.03 |
|
Information |
-20.14 |
-40.36 |
-19.27 |
-2.67 |
-45.98 |
-9.21 |
-33.31 |
44.57 |
-20.75 |
2.40 |
-109.56 |
-59.93 |
|
Telecommunication |
-15.05 |
-7.18 |
0.73 |
20.87 |
94.13 |
47.13 |
-8.79 |
11.13 |
-14.97 |
-32.80 |
-1.06 |
-17.75 |
|
Sovereign |
79.93 |
19.65 |
57.25 |
101.95 |
40.19 |
0.46 |
-69.98 |
-66.15 |
74.07 |
34.57 |
54.28 |
41.15 |
|
Fast Moving Consumer |
-10.92 |
-31.10 |
-29.92 |
-12.67 |
-20.42 |
-27.22 |
-14.19 |
-44.25 |
-61.40 |
-13.69 |
-11.82 |
-7.69 |
|
Others |
-7.57 |
52.46 |
18.99 |
21.19 |
38.00 |
4.85 |
25.18 |
16.09 |
-70.56 |
-0.79 |
45.33 |
17.64 |
|
Metals & Mining |
13.94 |
4.46 |
13.80 |
17.52 |
-1.09 |
-5.71 |
8.07 |
21.77 |
26.89 |
88.37 |
33.00 |
23.38 |
|
Power |
-20.03 |
-4.21 |
10.48 |
-1.42 |
-24.84 |
-0.90 |
-21.29 |
-14.21 |
-3.86 |
-15.47 |
23.15 |
12.45 |
|
Consumer Services |
-32.46 |
-1.14 |
-17.85 |
-16.77 |
-29.18 |
-10.75 |
-0.50 |
33.90 |
-19.52 |
-35.61 |
10.56 |
-52.38 |
|
Consumer Durables |
-3.26 |
-33.01 |
-2.13 |
-15.43 |
-13.79 |
12.73 |
4.01 |
1.98 |
3.22 |
-13.72 |
-4.34 |
-3.22 |
|
Services |
-31.88 |
-13.21 |
2.80 |
0.29 |
-6.17 |
-3.82 |
-32.38 |
-9.82 |
-16.01 |
-3.94 |
12.48 |
-0.74 |
|
Construction |
1.30 |
7.25 |
6.40 |
15.89 |
-3.31 |
-1.12 |
-1.76 |
3.81 |
-4.68 |
-10.77 |
18.20 |
27.42 |
|
Realty |
-20.95 |
-1.23 |
-3.08 |
12.79 |
0.24 |
-6.40 |
-3.06 |
8.66 |
-6.20 |
-19.92 |
4.77 |
-28.14 |
|
Chemicals |
0.23 |
-4.06 |
-3.16 |
-6.08 |
-5.18 |
-6.60 |
-0.23 |
-0.25 |
0.69 |
-0.21 |
6.42 |
-3.94 |
|
Construction |
-11.93 |
-2.20 |
-0.94 |
-11.80 |
-3.69 |
-5.10 |
-11.25 |
-5.49 |
-4.81 |
-3.76 |
3.78 |
-0.57 |
|
Textiles |
-1.19 |
-0.39 |
-2.03 |
-1.56 |
-1.86 |
-1.40 |
-2.63 |
-2.74 |
-1.76 |
-1.28 |
-0.67 |
-0.33 |
|
Media, Entertainment |
-0.16 |
0.93 |
0.87 |
-1.33 |
-1.48 |
-1.61 |
-0.39 |
-2.81 |
-1.23 |
-0.55 |
1.34 |
-0.62 |
|
Diversified |
-0.34 |
-1.98 |
-0.34 |
-0.70 |
0.46 |
0.10 |
-0.80 |
-0.29 |
-0.14 |
0.05 |
-0.02 |
0.02 |
|
Forest Materials |
-0.09 |
-0.48 |
0.77 |
0.17 |
-0.12 |
-0.29 |
-0.54 |
0.00 |
-0.10 |
0.12 |
0.30 |
0.08 |
|
Utilities |
-0.46 |
0.11 |
0.01 |
0.14 |
0.08 |
0.21 |
-0.13 |
-0.17 |
-1.26 |
0.24 |
-0.14 |
0.02 |
Source: NSDL
Related Tags
![]() IIFL Customer Care Number
IIFL Customer Care Number
(Gold/NCD/NBFC/Insurance/NPS)
1860-267-3000 / 7039-050-000
![]() IIFL Capital Services Support WhatsApp Number
IIFL Capital Services Support WhatsApp Number
+91 9892691696
Download The App Now
Follow us on
2026, IIFL Capital Services Ltd. All Rights Reserved
IIFL Capital Services Limited - Stock Broker SEBI Regn. No: INZ000164132 (Member ID - NSE: 10975 BSE: 179 MCX: 55995 NCDEX: 01249), DP SEBI Reg. No. IN-DP-185-2016, PMS SEBI Regn. No: INP000002213, IA SEBI Regn. No: INA000000623, Merchant Banker SEBI Regn. No. INM000010940, RA SEBI Regn. No: INH000000248, BSE Enlistment Number (RA): 5016, AMFI-Registered Mutual Fund Distributor & SIF Distributor
ARN NO : 47791 (Date of initial registration – 17/02/2007; Current validity of ARN – 08/02/2027), PFRDA Reg. No. PoP 20092018, IRDAI Corporate Agent (Composite) : CA1099

This Certificate Demonstrates That IIFL As An Organization Has Defined And Put In Place Best-Practice Information Security Processes.


