
Weekly Capital Flows Commentary: Feb 23 – Feb 27, 2026
Foreign portfolio investors recorded a net inflow of INR 8.18 billion during the week ended February 27, 2026. The overall inflow was supported by primary-market equity purchases along with continued debt inflows. However, the positive flows were partly offset by secondary equity selling and withdrawals from hybrid instruments, resulting in a relatively modest net inflow compared with the stronger inflows recorded in recent weeks.
Equity Markets: Total equity inflows for the week stood at INR 4.81 billion, primarily driven by primary-market investments of INR 14.73 billion. In contrast, the secondary market recorded net outflows of INR 9.92 billion, which limited the overall equity gains. Hybrid securities also saw a notable withdrawal of INR 26.42 billion, slightly offsetting the positive contribution from primary equity inflows.
Debt and Alternative Segments: Debt instruments remained a key contributor, attracting INR 29.3 billion in net inflows, indicating continued foreign interest in Indian fixed-income assets. Mutual funds saw marginal positive participation at INR 0.49 billion, while alternative investment funds (AIFs) recorded no net movement during the week.
Table: Net Investment Data
|
Asset Class |
Net Investment (INR Billions) |
|
Foreign_Investors |
8.18 |
|
Foreign_Investors.Debt |
29.3 |
|
Foreign_Investors.Equity |
4.81 |
|
Foreign_Investors.Equity.Primary |
14.73 |
|
Foreign_Investors.Equity.Secondary |
-9.92 |
|
Foreign_Investors.Mutual_Fund |
0.49 |
|
Foreign_Investors.Hybrid |
-26.42 |
|
Foreign_Investors.AIF |
0.0 |
Source: NSDL
Table: Recent history of FPI flows
|
Week Ending |
Net Investment (INR Billions) |
|
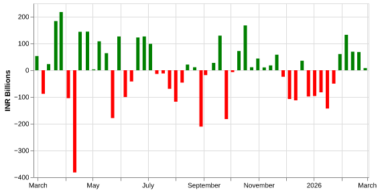
27 Feb, 2026 |
8.18 |
|
20 Feb, 2026 |
68.15 |
|
13 Feb, 2026 |
69.34 |
|
06 Feb, 2026 |
132.47 |
|
30 Jan, 2026 |
60.76 |
|
23 Jan, 2026 |
-50.27 |
|
16 Jan, 2026 |
-143.06 |
|
09 Jan, 2026 |
-82.27 |
|
02 Jan, 2026 |
-96.41 |
|
26 Dec, 2025 |
-98.09 |
Source: NSDL
Figure: History of FPI flows
FPI flows in Equity
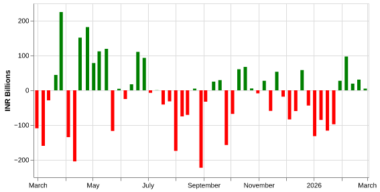
FPIs recorded modest net inflows in Indian equities during the week ended February 27, 2026, with total inflows of INR 4.8 billion. The positive balance was mainly supported by primary-market investments of INR 14.7 billion, while the secondary market witnessed net selling of INR 9.9 billion, which limited the overall equity inflows. The mixed trend indicates that while foreign investors continued to participate in new issuances, they remained cautious in the secondary market, trimming positions in existing stocks.
Recent flow patterns show that equity markets experienced significant foreign outflows during early January, before flows began stabilising toward the end of the month. The recovery strengthened in early February, largely driven by robust secondary-market buying, particularly in the week ended February 6, 2026. However, the latest week saw secondary-market activity turn negative again, even though primary-market participation remained positive, suggesting that foreign investors are adopting a more selective and cautious approach toward Indian equities.
Table: Recent history of FPI flows in equity
|
Week Ending |
FPI.Equity |
FPI.Equity.Primary |
FPI.Equity.Secondary |
|
27 Feb, 2026 |
4.8 |
14.7 |
-9.9 |
|
20 Feb, 2026 |
30.8 |
-0.4 |
31.2 |
|
13 Feb, 2026 |
19.4 |
24.0 |
-4.5 |
|
06 Feb, 2026 |
97.3 |
3.1 |
94.2 |
|
30 Jan, 2026 |
27.6 |
17.6 |
10.0 |
|
23 Jan, 2026 |
-97.4 |
5.5 |
-102.9 |
|
16 Jan, 2026 |
-116.0 |
5.2 |
-121.2 |
|
09 Jan, 2026 |
-85.1 |
0.3 |
-85.4 |
|
02 Jan, 2026 |
-131.7 |
1.3 |
-132.9 |
|
26 Dec, 2025 |
-43.9 |
5.4 |
-49.3 |
Source: NSDL
Figure: History of FPI flows in equity
FPI flows in Debt
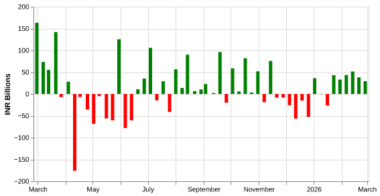
The latest weekly data shows that foreign portfolio investors remained net buyers in Indian debt during the week ended February 27, 2026, recording inflows of INR 29.3 billion. Although the inflow was lower than the stronger purchases seen in the preceding weeks, it still indicates continued foreign interest in the domestic debt market. The sustained inflows suggest that overseas investors are maintaining exposure to Indian fixed-income assets despite some moderation in the pace of buying.
The continued inflows were likely supported by relatively attractive yields in Indian sovereign bonds compared with global peers, which enhances the risk-adjusted appeal of domestic debt instruments. However, sentiment remains somewhat cautious amid global monetary tightening and intermittent risk aversion, indicating that foreign participation in the debt segment continues to be selective.
Table: Recent history of FPI flows in debt
Table: Recent history of FPI flows in debt
|
Week Ending |
Net Investment (INR Billions) |
|
27 Feb, 2026 |
29.3 |
|
20 Feb, 2026 |
38.1 |
|
13 Feb, 2026 |
51.4 |
|
06 Feb, 2026 |
43.4 |
|
30 Jan, 2026 |
33.2 |
|
23 Jan, 2026 |
43.0 |
|
16 Jan, 2026 |
-26.5 |
|
09 Jan, 2026 |
0.2 |
|
02 Jan, 2026 |
36.2 |
|
26 Dec, 2025 |
-52.7 |
Source: NSDL
Figure: History of FPI flows in debt
Related Tags
![]() IIFL Customer Care Number
IIFL Customer Care Number
(Gold/NCD/NBFC/Insurance/NPS)
1860-267-3000 / 7039-050-000
![]() IIFL Capital Services Support WhatsApp Number
IIFL Capital Services Support WhatsApp Number
+91 9892691696
Download The App Now
Follow us on
2026, IIFL Capital Services Ltd. All Rights Reserved
IIFL Capital Services Limited - Stock Broker SEBI Regn. No: INZ000164132 (Member ID - NSE: 10975 BSE: 179 MCX: 55995 NCDEX: 01249), DP SEBI Reg. No. IN-DP-185-2016, PMS SEBI Regn. No: INP000002213, IA SEBI Regn. No: INA000000623, Merchant Banker SEBI Regn. No. INM000010940, RA SEBI Regn. No: INH000000248, BSE Enlistment Number (RA): 5016, AMFI-Registered Mutual Fund Distributor & SIF Distributor
ARN NO : 47791 (Date of initial registration – 17/02/2007; Current validity of ARN – 08/02/2027), PFRDA Reg. No. PoP 20092018, IRDAI Corporate Agent (Composite) : CA1099

This Certificate Demonstrates That IIFL As An Organization Has Defined And Put In Place Best-Practice Information Security Processes.


