
Weekly Capital Flows Commentary: Mar 09 – Mar 13, 2026
Foreign portfolio investors recorded a sharp net outflow of INR 443.04 billion during the week ended March 13, 2026, marking a significant escalation in selling compared to the previous week’s outflow of INR 238.34 billion. The sustained withdrawal was largely driven by secondary-market selling in equities, which far outweighed the limited primary-market inflows. Additional outflows across debt, hybrid instruments, and mutual funds further reinforced the negative trend, reflecting a clear risk-off sentiment among foreign investors.
Equity Markets: Total equity flows for the week showed a net outflow of INR 361.82 billion, largely driven by substantial selling in the secondary market, which recorded withdrawals of INR 363.78 billion. This selling pressure overshadowed the modest primary market inflow of INR 1.95 billion, resulting in a sharp overall decline in equity flows. The continued dominance of secondary market outflows highlights sustained caution among foreign investors toward Indian equities.
Debt and Alternative Segments: Debt instruments registered net outflows of INR 75.19 billion, indicating a sharp reversal from prior inflows and reduced exposure to fixed-income assets. Hybrid securities saw minor withdrawals of INR 0.87 billion, while mutual funds recorded outflows of INR 5.16 billion. Meanwhile, alternative investment funds (AIFs) reported no net movement during the week, highlighting continued caution across segments.
Table: FPI flows for the week
|
Asset Class |
Net Investment (INR Billions) |
|
Foreign_Investors |
-443.04 |
|
Foreign_Investors.Debt |
-75.19 |
|
Foreign_Investors.Equity |
-361.82 |
|
Foreign_Investors.Equity.Primary |
1.95 |
|
Foreign_Investors.Equity.Secondary |
-363.78 |
|
Foreign_Investors.Mutual_Fund |
-5.16 |
|
Foreign_Investors.Hybrid |
-0.87 |
|
Foreign_Investors.AIF |
0.0 |
Source: NSDL
Table: Recent history of FPI flows
|
Week Ending |
Net Investment (INR Billions) |
|
13 Mar, 2026 |
-443.04 |
|
06 Mar, 2026 |
-238.34 |
|
27 Feb, 2026 |
8.18 |
|
20 Feb, 2026 |
68.15 |
|
13 Feb, 2026 |
69.34 |
|
06 Feb, 2026 |
132.47 |
|
30 Jan, 2026 |
60.76 |
|
23 Jan, 2026 |
-50.27 |
|
16 Jan, 2026 |
-143.06 |
|
09 Jan, 2026 |
-82.27 |
Source: NSDL
Figure: History of FPI flows
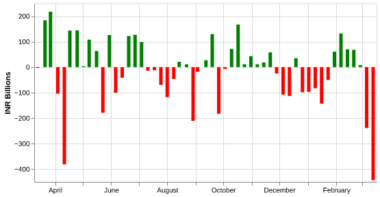
Source: NSDL
FPI flows in Equity
FPIs recorded significant net outflows from Indian equities during the week ended March 13, 2026, with total withdrawals of INR 361.8 billion. The negative balance was largely driven by heavy selling in the secondary market, which recorded net outflows of INR 363.8 billion, while the primary market saw only marginal inflows of INR 2.0 billion.
Compared with the previous week, which saw outflows of INR 218.8 billion, the latest week marked a sharp intensification in selling activity. It also represents the steepest weekly withdrawal in the recent period, contrasting with the net inflows observed in late January and February. The primary market provided only marginal support, compared to prior weeks when inflows had helped offset secondary-market selling, reflecting a sustained risk-off sentiment among foreign investors.
Table: Recent history of FPI flows in equity
|
Week Ending |
FPI.Equity |
FPI.Equity.Primary |
FPI.Equity.Secondary |
|
13 Mar, 2026 |
-361.8 |
2.0 |
-363.8 |
|
06 Mar, 2026 |
-218.8 |
3.0 |
-221.8 |
|
27 Feb, 2026 |
4.8 |
14.7 |
-9.9 |
|
20 Feb, 2026 |
30.8 |
-0.4 |
31.2 |
|
13 Feb, 2026 |
19.4 |
24.0 |
-4.5 |
|
06 Feb, 2026 |
97.3 |
3.1 |
94.2 |
|
30 Jan, 2026 |
27.6 |
17.6 |
10.0 |
|
23 Jan, 2026 |
-97.4 |
5.5 |
-102.9 |
|
16 Jan, 2026 |
-116.0 |
5.2 |
-121.2 |
|
09 Jan, 2026 |
-85.1 |
0.3 |
-85.4 |
Source: NSDL
Figure: History of FPI flows in equity
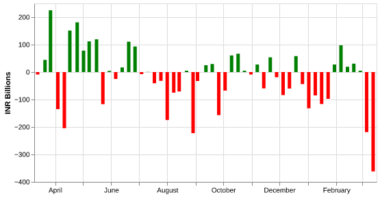
Source: NSDL
FPI flows in Debt
The latest weekly data shows that foreign portfolio investors turned net sellers in Indian debt during the week ended March 13, 2026, recording outflows of INR 75.2 billion. This marks a sharp reversal from the inflows seen in recent weeks, ending the positive momentum in the debt segment. The shift indicates a pullback in foreign participation in domestic fixed-income markets after a period of sustained buying.
Recent flow patterns show that debt markets had witnessed consistent foreign inflows from late January through February before the latest week saw flows turn sharply negative. The reversal suggests that foreign investors have turned more cautious toward Indian debt, reflecting a shift in overall risk sentiment and evolving global interest-rate expectations.
Table: Recent history of FPI flows in debt
|
Week Ending |
Net Investment (INR Billions) |
|
13 Mar, 2026 |
-75.2 |
|
06 Mar, 2026 |
-13.2 |
|
27 Feb, 2026 |
29.3 |
|
20 Feb, 2026 |
38.1 |
|
13 Feb, 2026 |
51.4 |
|
06 Feb, 2026 |
43.4 |
|
30 Jan, 2026 |
33.2 |
|
23 Jan, 2026 |
43.0 |
|
16 Jan, 2026 |
-26.5 |
|
09 Jan, 2026 |
0.2 |
Source: NSDL
Figure: History of FPI flows in debt
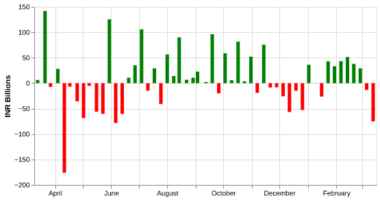
Source: NSDL
Related Tags
![]() IIFL Customer Care Number
IIFL Customer Care Number
(Gold/NCD/NBFC/Insurance/NPS)
1860-267-3000 / 7039-050-000
![]() IIFL Capital Services Support WhatsApp Number
IIFL Capital Services Support WhatsApp Number
+91 9892691696
Download The App Now
Follow us on
2026, IIFL Capital Services Ltd. All Rights Reserved
IIFL Capital Services Limited - Stock Broker SEBI Regn. No: INZ000164132 (Member ID - NSE: 10975 BSE: 179 MCX: 55995 NCDEX: 01249), DP SEBI Reg. No. IN-DP-185-2016, PMS SEBI Regn. No: INP000002213, IA SEBI Regn. No: INA000000623, Merchant Banker SEBI Regn. No. INM000010940, RA SEBI Regn. No: INH000000248, BSE Enlistment Number (RA): 5016, AMFI-Registered Mutual Fund Distributor & SIF Distributor
ARN NO : 47791 (Date of initial registration – 17/02/2007; Current validity of ARN – 08/02/2027), PFRDA Reg. No. PoP 20092018, IRDAI Corporate Agent (Composite) : CA1099

This Certificate Demonstrates That IIFL As An Organization Has Defined And Put In Place Best-Practice Information Security Processes.


