17 Nov 2026 , 07:59 PM
Gold and silver continued to be under pressure on Tuesday, November 17. Financial markets are pricing in a highly likely quarter point rise in interest rates by the US Fed at their December meeting. Gold is currently trading around $3,870 per ounce, down approximately 30% from its record high. It has however recovered slightly from its intra-day low of around $3,832 seen on Monday, which was its lowest in over a year. Silver is currently trading at around $47.30 per ounce, having hit a new low for the year since late October 2025. This is down around 61% from its record high of $121.65 seen on January 26.
The Indian market has mirrored this weakness. MCX gold for December is currently trading around ₹1,34,190 per 10 grams, down 0.26% in afternoon trade. Silver is trading around ₹1,69,163 per kg, up 0.77%. 24 karat retail gold in major cities was trading at around ₹1,35,000 per 10-gram ex-GST and making charges in morning trade. This is down from around ₹1,44,600 5 sessions ago. The rupee has also helped provide some support. Provisionally closing at 93.51 per dollar, up 43 paise. This was its highest in around 7 months due to lower crude prices and FPI flows.
This has been a two-week trend. COMEX gold futures for December have fallen around 4.6% over the course of the week to settle at $3,886.30 on Friday, November 13. It has then fallen further to settle at $3,853.00 on Monday, November 16. Silver has also fallen further. The gold to silver ratio has risen to around 82 compared to around 43 in January.
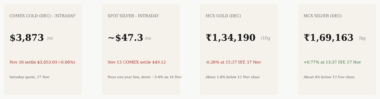
Figure 1: Price snapshot, 17 November 2026. The first two cards show intraday quotes and the most recent verified settlement. The MCX cards show mid-afternoon Indian session quotes. None of these is an official closing price for 17 November. See the Market Snapshot Table.
This table shows current intraday rates and latest confirmed settlement and closure rates. Intraday rates fluctuate throughout the day and are not closing rates. Where a settlement could not be obtained from a primary source it is noted.
| Instrument | Latest intraday (17 Nov) | Last settlement or close | Recent move |
| Spot gold (US$/oz) | About $3,870–3,878 | Not a settlement; Nov 16 COMEX Dec settlement $3,853.00 | Spot about $40 above the Nov 16 intraday low of about $3,832 |
| COMEX gold, Dec (US$/oz) | About $3,873; session high about $3,890 | $3,853.00 (Nov 16 settlement) | Down 0.86% on Nov 16; Nov 13 settlement $3,886.30 |
| Spot silver (US$/oz) | About $47.30 | COMEX Dec settlement $49.12 (Nov 13) | Fell about 3–4% on Nov 16; near one-year low |
| MCX gold, Dec (₹/10g) | ₹1,34,190 at 15:37 IST (down 0.26%) | About ₹1,36,705 (Nov 13 close) | About 1.8% lower than Nov 13 |
| MCX silver, Dec (₹/kg) | ₹1,69,163 at 15:37 IST (up 0.77%) | About ₹1,76,300–1,76,500 (Nov 13 close) | About 4% lower than Nov 13 |
| Retail 24K gold, Mumbai (₹/10g, before GST) | ₹1,35,310 (morning quote) | ₹1,38,490 (Nov 13, most-cities rate) | About 6.4% below the Nov 10 level of ₹1,44,600 |
Table 1: Intraday and closing references. MCX and retail quotes are indicative. The Nov 13 MCX closes are approximate because sources report values within a narrow range.
The downturn has been slow and steady. Gold prices have fallen about 15% over the past twelve weeks to November 13, one of the steepest slide over a number of months seen over the past two decades. Silver has also fallen, with values now around 9% lower at around $47.30 per ounce compared with the early November price of about $52.
| Session | COMEX gold, Dec (US$/oz) | COMEX silver, Dec (US$/oz) | What happened |
| Fri 6 Nov (derived) | About 4,075 | About 51.94 | Start of the weekly slide, derived from the reported weekly change |
| Fri 13 Nov (settlement) | 3,886.30 | 49.12 | Weekly loss of about 4.6% for gold and 5.4% for silver |
| Mon 16 Nov (settlement / intraday) | 3,853.00 settlement; intraday low 3,835.20 | Intraday low near 46.5; trading around 47.0–47.5 | Gold hit a one-year low after the inflation and Fed repricing; silver fell about 4% |
| Tue 17 Nov (intraday) | About 3,873; session high about 3,890 | About 47.30 | Modest rebound in gold; silver steady near the one-year low |
Table 2: COMEX December settlements and intraday ranges across recent sessions. The 6 November figures are derived from the reported weekly change, not from a published settlement.
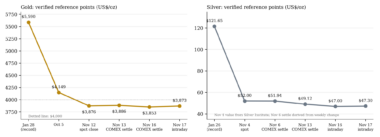
Figure 2: Verified reference points for gold and silver, from the January record to the November 17 intraday level. The series is not continuous, so the lines show selected data points, not a complete daily price history.
The main reason for the movement stems from a change in expectations for US monetary policy. The Fed voted 10-2 to leave its benchmark interest rate range unchanged at 3.75-4.00% during their meeting on the 28 th of October. However, two members of the committee (Governor Lisa Cook and Beth Hammack) had voted to hike interest rates. The statement from the committee noted that “Inflation remains elevated” and reaffirmed their commitment to bring inflation back down to 2%.
Data has continued to point towards a hawkish outcome. The Consumer Price Index increased by 0.4% in October, ahead of forecast. The Core CPI also increased by 0.3% for the third month in-a-row. However, due to the government shutdown in October 2025 the Bureau could not collect price data for October. Therefore, they did not release the 12-month inflation figure for October 2026. Markets have been looking at the monthly data and some private estimates showing that headline inflation came in at around 3.8% for the year. Producer Prices increased by 0.3% in October, meaning that annual producer inflation stands at 6.5%. This is the highest level since November 2022.
Futures data as of mid-November shows there is a 90-94% chance that a 25-basis point hike will be delivered at the December meeting. There is a smaller chance of a 50-basis point hike. With Fed Governor Christopher Waller stating that a half-point hike should be considered if inflation is not improving. However, Chair Kevin Warsh has not provided clear guidance. His comments at a conference in San Francisco on Monday the 16 th of November regarding Artificial Intelligence, Productivity and Jobs did not provide any clear signals.
The effects show up across four channels:
The stock market caused a negative impact this week, with the Nasdaq down 2.5% and the S&P 500 down 1.9%. Technology and semiconductor stocks were amongst the hardest hit due to fears surrounding AI valuations and stricter US export controls on chips. Usually, this would see an increase in demand for Treasuries, whereby yields fall and gold benefits from this risk off environment. However, this time around the market saw an increase in selling of both precious metals and equities, causing a negative impact on silver, which has an industrial element. The market has commented that this has been driven by liquidity.
The Middle East situation has certainly deteriorated with the US maintaining a naval embargo on Iranian ports. The Revolutionary Guards have claimed that numerous tankers have been hit by naval mines in and around the Strait of Hormuz. Six tankers were reported to be hit on November 15th and 16th. These claims have not yet been confirmed. Iran have stated the straits will remain closed until the US agree to the terms of allowing them to reopen. This includes lifting the embargo, sanctions and unfreezing assets. A regional Strait of Hormuz monitor shows it was restricted on Tuesday morning.
Oil prices have been volatile. Whilst crude prices have rallied due to the situation, they have fallen over 3% on Monday due to the expectation of a supply glut in Q4. Brent is currently trading around $92.
If we look at this within a traditional environment, then it would boost gold prices. However, we are seeing the reverse effect here. With oil prices up, it pushes inflation higher; boosting arguments for higher tightening. As policy rates rise, real yields increase and the dollar rises, putting downward pressure on gold. Now it seems the rate channel overpowering the safe-haven channel.
Silver has performed worse than gold in this current sell-off. Silver can be seen as both a monetary asset and an industrial commodity. Like gold, it will be affected by real yields and the US dollar. However, it is also very reliant on many sectors such as manufacturing, electronics, automotive and solar. Therefore, when rate hikes increase chances of an economic slowdown, silver comes under pressure.
On the industrial side, there is more nuance. The Silver Institute updated that industrial demand (excluding solar PV) is expected to rise by 4.5% in 2026 to approximately 492 million ounces. This is driven by demand in the electric vehicles, electrical infrastructure and brazing alloys. On the other hand, demand from solar is not looking great. Installations have been lower than expected (especially in China) and high silver prices have increased thrift and substitution. Industry reports from the World Silver Survey in April 2026 show that demand from solar silver is expected to fall by approximately 19% in 2026. This is the biggest year-on-year fall ever recorded. Overall industrial demand is expected to decrease by 3% to around 640 million ounces. This is still higher than 2019 levels by around 22%.
Overall demand for silver is expected to decrease by 5% to 1.08 billion ounces. Demand from jewellery and silverware is also decreasing substantially. Demand from jewellery is expected to fall by 22% and silverware by 17%. The Silver Institute also state that demand from India is moving towards lighter and smaller items. Overall demand from India is expected to fall by 10% this year.
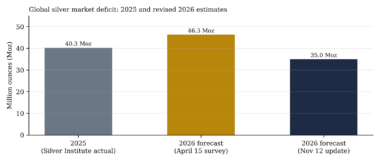
Figure 3: Silver market deficit, 2025 and 2026 estimates. The November 2026 update revised the 2026 forecast to 35 million ounces, down from the 46.3 million ounces projected in April. Source: Silver Institute and Metals Focus.
The deficit has reduced to 35 million ounces in 2026 according to the Silver Institute, down from 46.3 million in April. This is due to weak demand and increased recycling levels which are expected to increase by 6% to around 210 million ounces, the largest amount since 2012. The amount of silver held in ETPs fell to 1.25 billion ounces on November 3, down 55 million since the beginning of the year. Metals Focus expects net outflows from ETPs of 45 million ounces in 2026.
Central Bank and ETF Demand: The Floor Beneath Gold
Despite a firmer fundamental bid, gold is currently correcting. Central bank demand has increased in the third quarter of 2026 to 321 tonnes (+42% YoY), according to the World Gold Council. This is much higher than the 5-year average of 227 tonnes per quarter. Year-to-date official demand totals 675 tonnes, an increase of 6% compared to 2025. However, of the estimated amount purchased only 120 tonnes was officially published, with the biggest buyers being the People’s Bank of China and the National Bank of Poland.
Investment flows have also recovered. Global gold ETFs added 211 tonnes in the third quarter after outflows in the second quarter, lifting total holdings to a record 4,256 tonnes. Bar and coin demand fell 19% to its lowest quarterly level in four years, and jewellery demand fell 17% as high prices weighed on purchases. Technology demand rose 3%, supported by AI-related manufacturing.
The rupee and the import-duty wedge
The rupee has dipped as it settled provisionally at 93.51 per dollar on Tuesday up 43 paise against Monday’s closing level of 93.94 as crude prices saw losses while foreign inflows were seen. But a strong dollar index and high US yields are preventing it from rising too much. Market Analysts believe it will fluctuate between 93.20-93.75.
Domestic gold also remains higher than its international counterpart due to duties. India has increased the effective import duty on Gold and Silver to 15% from May 13, 2026. This is based on a 10% base duty, 5% agriculture cess along with 3% GST. If we take the spot price of around $3,873 and apply the current exchange rate and add the 15% duty, this works out to around ₹1,33,900 per 10 grams (within 0.2%). The MCX December contract is currently trading at around 3% higher for Silver meaning there is a higher premium locally. These are our figures and not official ones.
Demand, prices and inflation.
Retail demand has also fallen due to rising prices. Gold demand in India grew by 24% between Q2 and Q3 to hit 162 tonnes, down 29% against last year. Buyers are turning to smaller sizes as higher prices coupled with reduced rural spending. (Silver Institute report November)
Domestically, inflation has also increased. Inflation at retail level rose to 6.09% in October, surpassing the Reserve Bank of Indias’ upper limit of 6% for the first time in around two years. This means that there is a heightened likelihood of tightening at the Reserve Banks’ policy meeting in early December according to market economists.
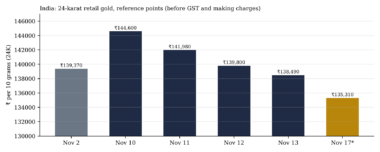
Figure 4: India, 24-karat retail gold per 10 grams (before GST and making charges), at selected dates. Sources are city rate quotes. *The 17 November figure is a mid-morning Mumbai quote. Days without reported rates are omitted, so the chart shows reference points, not a continuous series.
Gold and silver ETFs
Gold and silver mutual funds have seen a tug of war between investors. Net flows into gold ETFs were down by around 22 percent at 3474 crore rupees in October against 4451 crore rupees seen in September. On the brighter note, flows into silver ETFs rose by around 57 percent to 3092 crore rupees. But many fund houses stopped accepting any new lumpsum or SIP investments in gold and silver fund of funds from October 16, which needs to be factored in. Gold ETFs saw flows still much higher than their six month average in October, said one fund house.
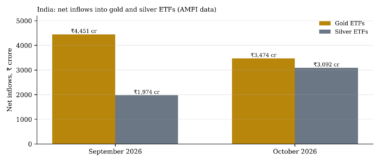
Figure 5: Net inflows into gold and silver ETFs in India, September, and October 2026. Source: AMFI data
Sectors and Companies in Focus
Important Upcoming Economic Events
The calendar over the next few weeks will determine whether the rate-hike narrative holds. The dates below come from market calendars and official schedules where available. Those marked as to be confirmed should be checked against official sources before publication.
| Date | Event | Why it matters for gold and silver |
| Tue 17 Nov (US session) | US October retail sales and industrial production | A firm consumer reading supports the case for a December hike and pressures metals |
| Wed 18 Nov, 2:00 pm ET | Minutes of the October 27–28 FOMC meeting | Shows how many officials favoured tightening and whether a larger move was discussed |
| 25 Nov (per market calendars) | US October PCE inflation | The Fed’s preferred inflation gauge. A hot print would reinforce the December hike case |
| Early Dec (date to be confirmed) | US November employment report | Labour-market strength is central to the Fed’s next decision |
| 2–4 Dec (per market calendars) | Reserve Bank of India policy meeting | Domestic rate decision. Inflation above 6% raises the odds of tightening |
| 9 Dec (per market calendars) | FOMC rate decision | The single most important event for gold and silver in the near term |
| 11 Dec (per market calendars) | US funding deadline | Adds fiscal uncertainty and can move the dollar and yields |
Table 4: Key events. Dates are as reported in market calendars and should be confirmed on official sites (federalreserve.gov, bls.gov, rbi.org.in) before publication.
Short-Term Outlook: Bullish and Bearish Cases
The bullish case
The bearish case
Our short-term bias is negative while the rate outlook remains unsettled and the dollar stays firm. The medium-term structural case, supported by central bank buying and persistent fiscal pressures, remains intact.
Key Takeaways for November 17, 2026
Related Tags


 IIFL Customer Care Number
(Gold/NCD/NBFC/Insurance/NPS)
1860-267-3000 / 7039-050-000
 IIFL Capital Services Support WhatsApp Number
+91 9892691696
Download The App Now


Follow us on


2026, IIFL Capital Services Ltd. All Rights Reserved

IIFL Capital Services Limited - Stock Broker SEBI Regn. No: INZ000164132 (Member ID - NSE: 10975 BSE: 179 MCX: 55995 NCDEX: 01249), DP SEBI Reg. No. IN-DP-185-2016, Merchant Banker SEBI Regn. No. INM000010940, RA SEBI Regn. No: INH000000248, BSE Enlistment Number (RA): 5016, AMFI-Registered Mutual Fund Distributor & SIF Distributor
ARN NO : 47791 (Date of initial registration – 17/02/2007; Current validity of ARN – 08/02/2027), PFRDA Reg. No. PoP 20092018, IRDAI Corporate Agent (Composite) : CA1099

This Certificate Demonstrates That IIFL As An Organization Has Defined And Put In Place Best-Practice Information Security Processes.