
13 Mar 2026 , 12:29 PM
India’s CPI inflation rose to 3.21% in February 2026 from 2.75% in January under the new CPI series (Base 2024=100), marking a moderate increase in price pressures. The rise was mainly driven by a 124bps jump in Food and Beverages inflation to 3.35%, reflecting volatility in vegetables such as tomatoes, alongside gains in paan, tobacco and personal effects, while core inflation remained steady near 3.4%, indicating limited broad-based pressure. Rural inflation strengthened to 3.37% compared with urban inflation at 3.02%, suggesting resilient countryside demand despite lower food weights in the revised basket. Overall inflation remains well within the RBI’s 2–6% tolerance band and broadly aligns with FY26 projections near 3.2%, supporting expectations of a steady policy stance with the repo rate likely to remain around 6.25%, though risks remain from imported inflation due to higher oil prices amid Middle East tensions and INR depreciation.
Figure: Overall CPI YoY – Current Series vs 2012 Series
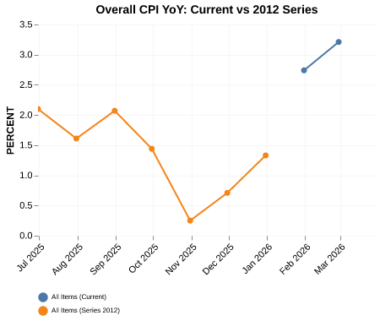
Table: Overall CPI (All Items) – YoY Comparison
|
Series |
Latest YoY |
Prev YoY |
MoM Change |
|
All Items (Current) |
3.21 |
2.75 |
0.46 |
Source: MOSPI
Overall CPI Inflation Accelerates to 3.21%
India’s headline CPI inflation under the new 2024=100 base rose to 3.21% YoY in February 2026 from 2.75% prior, with a 0.46% MoM gain, reflecting food volatility (3.35%) amid rural-urban divergence (3.37% vs. 3.02%). This uptick, versus January’s 2.75% debut in the revised basket (that emphasised services and housing), signals contained yet firming pressures within RBI’s 2-6% band. Consequently, it tempers expectations for near-term rate cuts, anchoring the RBI’s steady 6.25% repo path amid robust core readings (~3.4%). That said, risk remains due to sharply higher oil prices and the consequent imported inflation.
Rural vs Urban Inflation Trend
Rural inflation is firming, with the YoY rate climbing to 3.37% from 2.73%—a 0.64 ppt jump month over month—while urban inflation remains moderate, rising to 3.02% from 2.75% and posting only a 0.27 ppt rise. This divergence signals resilient countryside demand despite base effects. For markets, it supports RBI’s steady 2026 policy path with headline at 3.21%, well below the 4% target, anchoring IGB yields lower and favouring duration extension.
Figure: Rural vs Urban CPI Inflation – YoY Heatmap
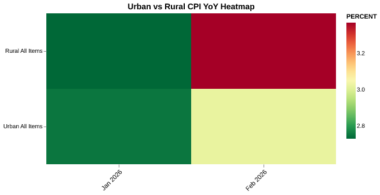
Table: Rural vs Urban CPI (All Items) – YoY Comparison
|
Series |
Latest YoY |
Prev YoY |
MoM Change |
|
Rural All Items |
3.37 |
2.73 |
0.64 |
|
Urban All Items |
3.02 |
2.75 |
0.27 |
Source: MOSPI
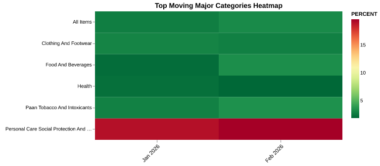
Inflation Breadth Drives Yield and Sector Outlook
A sharp 124bps surge in Food and Beverages (3.35% from 2.11%)—reflecting renewed supply pressures amid base effects in the new 2024-series basket—and a 63bps rise in Paan, Tobacco, and Intoxicants (3.49%), while Personal Care and Miscellaneous added 58bps (19.64%). This reflects narrowed inflation breadth, with just three categories fueling the uptick against seven showing deceleration, including core-sensitive Transport (-0.05%) and Health (1.90%). The pickup reinforces the RBI’s pause on rate cuts, anchoring the policy path at current levels through mid-2026 and steepening the front-end yield curve (2–5Y G-Secs up 5–10bps). INR faces mild depreciation risks (to 84.5/USD) on imported inflation pass-through, favouring defensive FMCG and Pharma equity positioning over cyclicals amid sticky services inflation.
Figure: Major CPI Categories – YoY Heatmap
Source: MOSPI
Table: Major CPI Categories – YoY Comparison
|
Category |
Latest YoY (Feb 2026) |
Prev YoY (Jan 2026) |
MoM Change |
|
Food And Beverages |
3.35 |
2.11 |
1.24 |
|
Paan Tobacco And Intoxicants |
3.49 |
2.86 |
0.63 |
|
Personal Care, Social Protection, and Miscellaneous Goods And Services |
19.64 |
19.06 |
0.58 |
|
All Items |
3.21 |
2.75 |
0.46 |
|
Health |
1.90 |
2.19 |
-0.29 |
|
Clothing And Footwear |
2.81 |
2.97 |
-0.16 |
|
Restaurants And Accommodation Services |
2.73 |
2.87 |
-0.14 |
|
Transport |
-0.05 |
0.09 |
-0.14 |
|
Recreation, Sport, and Culture |
2.21 |
2.32 |
-0.11 |
|
Information And Communication |
0.25 |
0.16 |
0.09 |
Source: MOSPI
Item-Level Inflation Trends
The latest CPI snapshot shows a mixed but still inflation-sticky picture. Three of the four top movers—Paan and Tobacco, Other Personal Effects, and Food—are accelerating, with YoY gains climbing from 1.9% to 3.6% (tobacco) and from 59% to 61% (personal effects), alongside MoM acceleration above +1.3. This suggests price pressures concentrated in a few consumer categories rather than broad-based inflation. By contrast, Inpatient Care services are decelerating, with YoY falling to 1.9% from 3.0% and a negative MoM shift (-1.1%). While healthcare inflation eases, persistent price gains across key consumer categories point to continued inflationary pressure.
Figure: Key CPI Item Movers – YoY Heatmap
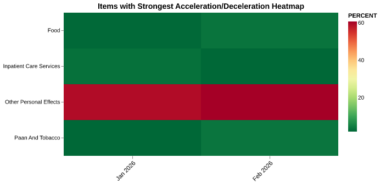
Table: Key CPI Item Movers – YoY Comparison
|
Item |
Latest YoY (Feb 2026) |
Prev YoY (Jan 2026) |
MoM Acc/Dec |
|
Paan And Tobacco |
3.64 |
1.95 |
1.69 |
|
Other Personal Effects |
60.80 |
59.34 |
1.46 |
|
Food |
3.47 |
2.13 |
1.34 |
|
Inpatient Care Services |
1.94 |
3.03 |
-1.09 |
Source: MOSPI
Related Tags
![]() IIFL Customer Care Number
IIFL Customer Care Number
(Gold/NCD/NBFC/Insurance/NPS)
1860-267-3000 / 7039-050-000
![]() IIFL Capital Services Support WhatsApp Number
IIFL Capital Services Support WhatsApp Number
+91 9892691696
Download The App Now
Follow us on
2026, IIFL Capital Services Ltd. All Rights Reserved
IIFL Capital Services Limited - Stock Broker SEBI Regn. No: INZ000164132 (Member ID - NSE: 10975 BSE: 179 MCX: 55995 NCDEX: 01249), DP SEBI Reg. No. IN-DP-185-2016, PMS SEBI Regn. No: INP000002213, IA SEBI Regn. No: INA000000623, Merchant Banker SEBI Regn. No. INM000010940, RA SEBI Regn. No: INH000000248, BSE Enlistment Number (RA): 5016, AMFI-Registered Mutual Fund Distributor & SIF Distributor
ARN NO : 47791 (Date of initial registration – 17/02/2007; Current validity of ARN – 08/02/2027), PFRDA Reg. No. PoP 20092018, IRDAI Corporate Agent (Composite) : CA1099

This Certificate Demonstrates That IIFL As An Organization Has Defined And Put In Place Best-Practice Information Security Processes.


