
Smallcaps In February 2026 – 0.3%
In February 2026, the Nifty Smallcap 100 index closed largely flat with a return of 0.3%. However, this was better than the large-cap NIFTY index, which declined during the month. This also marks a mild recovery after three consecutive months of losses. The recovery was driven by strong performances from sectors like Healthcare, led by stocks such as ASTERDM and LAURUSLABS, while Utilities declined sharply by 15.15%, primarily due to losses in Reliance Power Ltd. The market breadth was slightly negative with 47 stocks advancing and 51 declining.
Chart: Monthly Return Chart
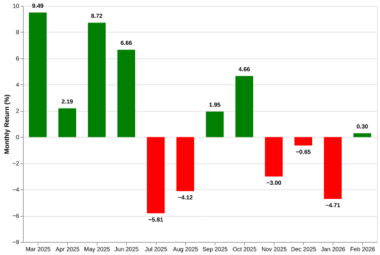
Source: NSE
How was the market breadth? 47 advances, while 51 declines:
In Feb-2026, the market breadth was slightly negative with 47 stocks advancing and 51 declining. In comparison to the last month, this represents an improvement, as January saw a much broader decline with only 18 advancing stocks.
Table: Advances and Declines history
| Month | Advances | Declines | Advance/Decline Ratio |
| Feb-2026 | 47 | 51 | 0.92 |
| Jan-2026 | 18 | 80 | 0.22 |
| Dec-2025 | 43 | 55 | 0.78 |
| Nov-2025 | 30 | 68 | 0.44 |
| Oct-2025 | 65 | 33 | 1.97 |
| Sep-2025 | 60 | 39 | 1.54 |
| Aug-2025 | 20 | 78 | 0.26 |
| Jul-2025 | 28 | 71 | 0.39 |
| Jun-2025 | 72 | 27 | 2.67 |
| May-2025 | 86 | 13 | 6.62 |
| Apr-2025 | 52 | 47 | 1.11 |
| Mar-2025 | 83 | 16 | 5.19 |
Source: NSE
Chart: Trends In ADR Ratio
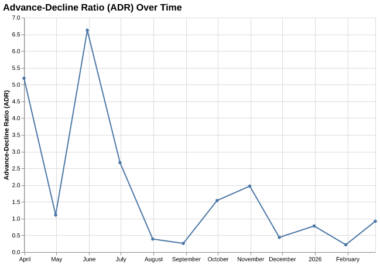
Source: NSE
Healthcare performs the best while Utilities performs the worst:
Healthcare was the best-performing sector in the latest month with a weighted return of 5.84%, supported by gains in stocks such as ASTERDM and LAURUSLABS. On the other hand, Utilities was the worst-performing sector, declining by 15.15%, primarily due to losses in Reliance Power Ltd.
Table: Performance Across Sectors
| Sector | Number Of Stocks | % Change (w. avg) | % Change (avg) |
| Healthcare | 4 | 5.84 | 3.19 |
| Commodities | 8 | 5.24 | 6.74 |
| Consumer Discretionary | 9 | 3.42 | 1.48 |
| Energy | 4 | 2.62 | 3.18 |
| Financial Services | 18 | -1.06 | -0.28 |
| Industrials | 20 | -2.0 | -3.49 |
| Services | 4 | -2.51 | -3.85 |
| Telecommunication | 3 | -4.78 | -6.77 |
| Fast-moving Consumer Goods | 1 | -6.33 | -6.33 |
| Information Technology | 6 | -15.09 | -15.3 |
| Utilities | 1 | -15.15 | -15.15 |
Source: NSE
Chart: Sector Performance Heatmap Over the Past Year
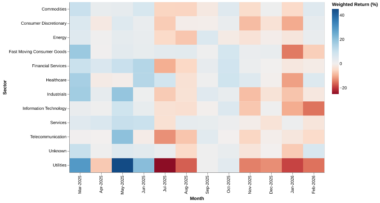
Source: NSE
Top performers over a 1 Year Horizon:
Over the past year, the top performers were led by Multi Commodity Exchange of India Ltd, Data Patterns (India) Ltd and Laurus Labs Ltd with returns of 146.55%, 123.95%, and 104.51%, respectively. These stocks were primarily from the Financial Services and Industrials sectors.
Table: Top-15
| Stock | Sector | % Change (1Y) |
| Multi Commodity Exchange of India Ltd | Financial Services | 146.55 |
| Data Patterns (India) Ltd | Industrials | 123.95 |
| Laurus Labs Ltd | Healthcare | 104.51 |
| Karur Vysya Bank Ltd | Financial Services | 98.18 |
| Garden Reach Shipbuilders Engineers Ltd | Industrials | 95.16 |
| Delhivery Ltd | Services | 73.46 |
| IDBI Bank Ltd | Financial Services | 71.13 |
| Great Eastern Shipping Company Ltd | Services | 68.48 |
| Navin Fluorine International Ltd | Commodities | 66.71 |
| IIFL Finance Ltd | Financial Services | 65.58 |
| Poonawalla Fincorp Ltd | Financial Services | 61.68 |
| HBL Engineering Ltd | Industrials | 58.7 |
| IFCI Ltd | Financial Services | 45.97 |
Source: NSE
Bottom performers over a 1 Year Horizon:
Over the past year, the bottom performers included Newgen Software Technologies Ltd, Five-Star Business Finance Ltd, and Brainbees Solutions Ltd with returns of -45.39%, -45.03%, and -42.27%, respectively. These stocks were primarily from the Information Technology and Financial Services sectors.
Table: Bottom-15
| Stock | Sector | % Change (1Y) |
| Newgen Software Technologies Ltd | Information Technology | -45.39 |
| Five-Star Business Finance Ltd | Financial Services | -45.03 |
| Brainbees Solutions Ltd | Consumer Discretionary | -42.27 |
| Inox Wind Ltd | Industrials | -38.66 |
| Firstsource Solutions Ltd | Services | -38.4 |
| Aditya Birla Real Estate Ltd | Commodities | -30.69 |
| Tata Teleservices (Maharashtra) Ltd | Telecommunication | -30.12 |
| Afcons Infrastructure Ltd | Industrials | -28.85 |
| Reliance Power Ltd | Utilities | -27.93 |
| Brigade Enterprises Ltd | Consumer Discretionary | -26.53 |
| Cyient Ltd | Information Technology | -26.3 |
| Sonata Software Ltd | Information Technology | -24.17 |
| Devyani International Ltd | Consumer Discretionary | -22.77 |
Source: NSE
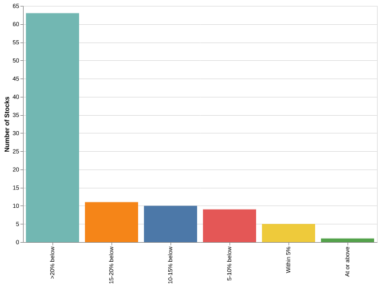
Stocks Near 52 Week Highs:
As of the end of last month, nearly 63 stocks were more than 20% away from their 52-week highs. Only 6 stocks were within 5% of their 52-week highs, with IDBI Bank Ltd, Great Eastern Shipping Company Ltd, Data Patterns (India) Ltd, and Karur Vysya Bank Ltd being the closest.
Table: Stocks within 10% of 52 Week High
| Stock | Sector | Last Close | 52 Week High | vs 52 Week High (%) |
| IDBI Bank Ltd | Financial Services | 116.01 | 116.01 | 0.0 |
| Great Eastern Shipping Company Ltd | Services | 1338.9 | 1348.9 | -0.74 |
| Data Patterns (India) Ltd | Industrials | 3210.2 | 3243.6 | -1.03 |
| Karur Vysya Bank Ltd | Financial Services | 326.2 | 336.85 | -3.16 |
| Laurus Labs Ltd | Healthcare | 1075.8 | 1128.5 | -4.67 |
| Kalpataru Projects International Ltd | Industrials | 1240.1 | 1314.5 | -5.66 |
| Navin Fluorine International Ltd | Commodities | 6256.5 | 6649.5 | -5.91 |
| Himadri Speciality Chemical Ltd | Commodities | 484.85 | 517.8 | -6.36 |
| Aarti Industries Ltd | Commodities | 447.15 | 485.4816 | -7.9 |
| Multi Commodity Exchange of India Ltd | Financial Services | 2447.0 | 2704.0 | -9.5 |
| Go Digit General Insurance Ltd | Financial Services | 335.75 | 372.35 | -9.83 |
Source: NSE
Chart: Distribution of stocks vs their 52-week highs
Source: NSE
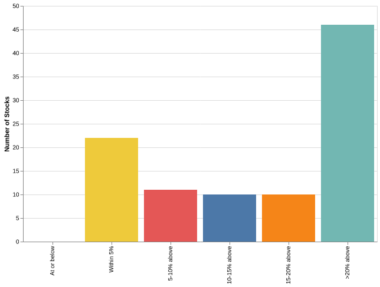
Stocks Near 52 Week Lows:
As of the end of last month, nearly 46 stocks were more than 20% away from their 52-week lows. Only 22 stocks were within 5% of their 52-week lows, with Cyient Ltd, Sonata Software Ltd, Afcons Infrastructure Ltd, and Brigade Enterprises Ltd being the closest.
Table: Stocks within 10% of 52 Week Low
| Stock | Sector | Last Close | 52 Week Low | vs 52 Week Low |
| Cyient Ltd | Information Technology | 912.0 | 912.0 | 0.0 |
| Sonata Software Ltd | Information Technology | 267.7 | 267.7 | 0.0 |
| Afcons Infrastructure Ltd | Industrials | 292.15 | 292.15 | 0.0 |
| Brigade Enterprises Ltd | Consumer Discretionary | 694.05 | 694.05 | 0.0 |
| Tata Teleservices (Maharashtra) Ltd | Telecommunication | 41.59 | 41.59 | 0.0 |
| Firstsource Solutions Ltd | Services | 213.15 | 213.15 | 0.0 |
| Five-Star Business Finance Ltd | Financial Services | 417.15 | 417.15 | 0.0 |
| Inox Wind Ltd | Industrials | 92.13 | 92.13 | 0.0 |
| Reliance Power Ltd | Utilities | 23.97 | 23.97 | 0.0 |
| KEC International Ltd | Industrials | 585.3 | 582.65 | 0.45 |
| Castrol India Ltd | Energy | 186.91 | 182.66 | 2.33 |
| Piramal Pharma Ltd | Healthcare | 156.13 | 151.41 | 3.12 |
| Brainbees Solutions Ltd | Consumer Discretionary | 217.4 | 210.5 | 3.28 |
| Affle 3i Ltd | Information Technology | 1377.2 | 1329.6 | 3.58 |
| Indian Energy Exchange Ltd | Financial Services | 125.16 | 120.7 | 3.7 |
| Tata Chemicals Ltd | Commodities | 717.4 | 690.0 | 3.97 |
| Titagarh Rail Systems Ltd | Industrials | 700.5 | 673.1995 | 4.06 |
| Sagility Ltd | Information Technology | 39.55 | 37.9526 | 4.21 |
| Zensar Technologies Ltd | Information Technology | 562.0 | 537.8 | 4.5 |
| Ircon International Ltd | Industrials | 143.61 | 136.292 | 5.37 |
| Aegis Logistics Ltd | Energy | 688.45 | 651.35 | 5.7 |
| Jupiter Wagons Ltd | Industrials | 267.2 | 252.7 | 5.74 |
| Triveni Turbine Ltd | Industrials | 489.2 | 460.231 | 6.29 |
| Aditya Birla Real Estate Ltd | Commodities | 1290.2 | 1195.4 | 7.93 |
| NCC Ltd | Industrials | 152.64 | 141.13 | 8.16 |
| Chambal Fertilisers Chemicals Ltd | Commodities | 457.95 | 420.3 | 8.96 |
| PNB Housing Finance Ltd | Financial Services | 824.75 | 753.6 | 9.44 |
| Computer Age Management Services Ltd | Financial Services | 677.6 | 616.7247 | 9.87 |
| Newgen Software Technologies Ltd | Information Technology | 508.75 | 463.05 | 9.87 |
Source: NSE
Chart: Distribution of stocks vs their 52 week Low
Source: NSE
Related Tags
![]() IIFL Customer Care Number
IIFL Customer Care Number
(Gold/NCD/NBFC/Insurance/NPS)
1860-267-3000 / 7039-050-000
![]() IIFL Capital Services Support WhatsApp Number
IIFL Capital Services Support WhatsApp Number
+91 9892691696
Download The App Now
Follow us on
2026, IIFL Capital Services Ltd. All Rights Reserved
IIFL Capital Services Limited - Stock Broker SEBI Regn. No: INZ000164132 (Member ID - NSE: 10975 BSE: 179 MCX: 55995 NCDEX: 01249), DP SEBI Reg. No. IN-DP-185-2016, PMS SEBI Regn. No: INP000002213, IA SEBI Regn. No: INA000000623, Merchant Banker SEBI Regn. No. INM000010940, RA SEBI Regn. No: INH000000248, BSE Enlistment Number (RA): 5016, AMFI-Registered Mutual Fund Distributor & SIF Distributor
ARN NO : 47791 (Date of initial registration – 17/02/2007; Current validity of ARN – 08/02/2027), PFRDA Reg. No. PoP 20092018, IRDAI Corporate Agent (Composite) : CA1099

This Certificate Demonstrates That IIFL As An Organization Has Defined And Put In Place Best-Practice Information Security Processes.


