

FII flows witnessed a net equity outflow of INR 32 bn and a net debt outflow of INR 41 bn last week. The consecutive weekly outflows from equities are the first in 10 weeks. Lacklustre earnings from many firms with significant FII holdings have likely led to profit booking. Additionally, country rotation trades (into better-performing Asian and Global markets) continue to impact flows into Indian equities.
FPI flows for the week
FII flows for the last week experienced a net outflow of INR 69.4 billion. While IPOs continued to remain attractive for FIIs, they sold secondary equity and debt investments. Primary equities received a significant inflow of INR 80.38 billion. Secondary equities had a substantial outflow of INR 112.18 billion. The Debt category also witnessed outflows of INR 40.98 billion. Mutual Funds witnessed a modest inflow.
Figure: YTD FPI/FII flows for the week ending 2025-07-25
| Asset Class | Net Investment (INR Billions) |
| Equity | -31.8 |
| Equity – Primary | 80.4 |
| Equity – Secondary | -112.2 |
| Debt | -41.0 |
| Hybrid | -0.1 |
| AIF | 0.0 |
| Mutual Fund | 3.5 |
| Total | -69.4 |
Source: NSDL
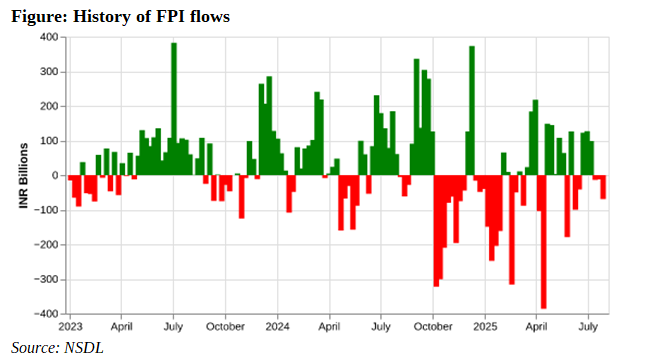
A weekly history of FPI flows:
FII flows have witnessed significant volatility in 2025. After a weak start to the year, FII inflows had improved since March. While April saw a few bad weeks, they had improved remarkably since May. However, they have turned negative for the past three weeks. This marks a reversal from the significant FII inflows during June. Last week’s FII outflow of INR 69 billion is below the long-term average of INR 25 billion. It is also below the year-to-date average weekly net outflow of INR 22 billion.
Figure: Recent history of FPI flows
| Week Ending | Net Investment (INR Billions) |
| 2025-05-23 | -178.9 |
| 2025-05-30 | 126.5 |
| 2025-06-06 | -100.3 |
| 2025-06-13 | -41.7 |
| 2025-06-20 | 122.2 |
| 2025-06-27 | 126.6 |
| 2025-07-04 | 98.8 |
| 2025-07-11 | -13.5 |
| 2025-07-18 | -12.1 |
| 2025-07-25 | -69.4 |
Source: NSDL
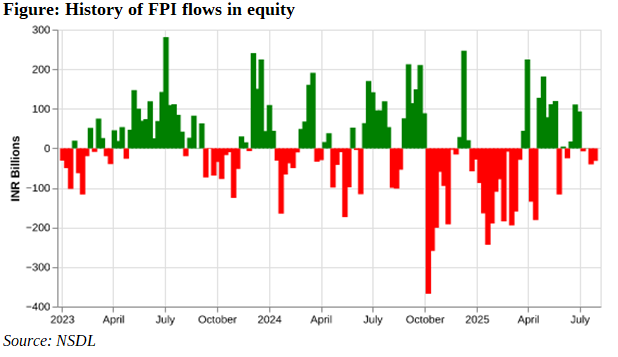
A weekly history of FPI flows in Equity:
The FII/FPI net flow into equities during the week at INR -31 billion is lower than the long-term weekly average of INR 6 billion, but is also lower than the year-to-date average of INR -29 billion. An analysis of the past few weeks indicates that FIIs have been net sellers in 3 of the past 5 weeks and 5 of the past 10 weeks. Also, last week was the first time in 10 weeks when FIIs sold for consecutive weeks.
Figure: Recent history of FPI flows in equity
| Week Ending | Net Investment (INR Billions) |
| 2025-05-23 | -116.7 |
| 2025-05-30 | 4.3 |
| 2025-06-06 | -24.8 |
| 2025-06-13 | 17.1 |
| 2025-06-20 | 110.5 |
| 2025-06-27 | 93.1 |
| 2025-07-04 | -7.3 |
| 2025-07-11 | 0.7 |
| 2025-07-18 | -40.9 |
| 2025-07-25 | -31.8 |
Source: NSDL
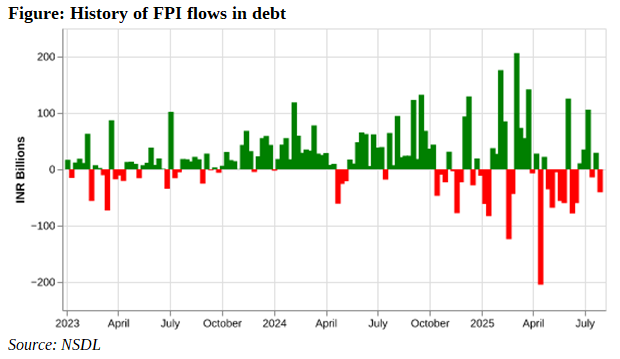
A weekly history of FPI flows in Debt:
FIIs were net sellers in debt markets last week. The outflow of INR 41 billion is below the long-term weekly average of the inflow of INR 17 billion. This is also below the YTD weekly average of INR 7 billion (net inflow). An analysis of the past few weeks indicates that FIIs’ inflows in debt were relatively better. They were negative in only 2 of the past five weeks. In 2025, after a largely positive start to the year (positive debt inflows), flows into debt have been concerning in recent months.
Figure: Recent history of FPI flows in debt
| Week Ending | Net Investment (INR Billions) |
| 2025-05-23 | -60.2 |
| 2025-05-30 | 125.3 |
| 2025-06-06 | -78.2 |
| 2025-06-13 | -60.3 |
| 2025-06-20 | 10.8 |
| 2025-06-27 | 35.3 |
| 2025-07-04 | 105.8 |
| 2025-07-11 | -14.6 |
| 2025-07-18 | 29.3 |
| 2025-07-25 | -41.0 |
Source: NSDL
How have the major indices, currencies and commodities performed?
Last week saw a mixed bag with regards to asset classes. On the commodities front, Copper outperformed Gold and Silver. Copper was up 3.3% while Gold and Silver were down modestly. Crude Oil, on the other hand, slipped 3.2%.
On the Equities front, US markets continued to rally. S&P 500, Nasdaq and Dow Jones climbed 1.46%, 1.02% and 1.26%, respectively. Emerging Markets, too, participated in the rally. MSCI EM and MSCI EM Asia rose by 0.88% and 0.96%, respectively. Chinese markets rallied strongly with the Hang Seng up 2.3%. Indian markets underperformed again with the NIFTY falling 0.5%.
Separately, the INR depreciated 0.4% and the US Dollar Index (DXY) depreciated by 0.84%.
Figure: Performance of Key Indices, Currencies and Commodities
| Asset Class | Value | % Change |
| Commodities | ||
| Gold | 3334.0 | -0.6 |
| Silver | 38.2 | -0.1 |
| Copper | 5.8 | 3.3 |
| Crude Oil | 65.2 | -3.2 |
| Currencies | ||
| DXY | 97.7 | -0.8 |
| USD INR | 86.4 | 0.4 |
| Indices | ||
| SP 500 | 6388.6 | 1.5 |
| NASDAQ | 21108.3 | 1.0 |
| MSCI EM | 49.5 | 0.9 |
| MSCI EM Asia | 85.4 | 1.0 |
| KOSPI | 3196.1 | 0.3 |
| TAIEX | 23364.4 | -0.1 |
| Hang Seng | 25388.3 | 2.3 |
| NIFTY 50 | 24837.0 | -0.5 |
Source: Yahoo Finance
YTD FPI flows
The YTD FII inflows paint a mixed picture, with some asset classes experiencing significant outflows, while others have received substantial inflows. Overall, there was a net outflow of INR 550.31 billion by FIIs from India. Secondary Equities witnessed the biggest outflow of INR 1162.3 billion. However, IPOs remained attractive, and they saw a net inflow of INR 357.6 billion. Overall, Equities witnessed an outflow of INR 804.7 billion. While debt flows have been concerning of late, YTD debt flows are still positive at INR 266 billion.
Figure: YTD FPI/FII flows
| Asset Class | Net Investment (INR Billions) |
| Equity | -804.7 |
| Equity – Primary | 357.6 |
| Equity – Secondary | -1162.3 |
| Debt | 266.0 |
| Hybrid | -14.4 |
| AIF | 0.0 |
| Mutual Fund | 2.8 |
| Total | -550.3 |
Source: NSDL
Related Tags
![]() IIFL Customer Care Number
IIFL Customer Care Number
(Gold/NCD/NBFC/Insurance/NPS)
1860-267-3000 / 7039-050-000
![]() IIFL Capital Services Support WhatsApp Number
IIFL Capital Services Support WhatsApp Number
+91 9892691696
Download The App Now
Follow us on
2026, IIFL Capital Services Ltd. All Rights Reserved
IIFL Capital Services Limited - Stock Broker SEBI Regn. No: INZ000164132 (Member ID - NSE: 10975 BSE: 179 MCX: 55995 NCDEX: 01249), DP SEBI Reg. No. IN-DP-185-2016, PMS SEBI Regn. No: INP000002213, IA SEBI Regn. No: INA000000623, Merchant Banker SEBI Regn. No. INM000010940, RA SEBI Regn. No: INH000000248, BSE Enlistment Number (RA): 5016, AMFI-Registered Mutual Fund Distributor & SIF Distributor
ARN NO : 47791 (Date of initial registration – 17/02/2007; Current validity of ARN – 08/02/2027), PFRDA Reg. No. PoP 20092018, IRDAI Corporate Agent (Composite) : CA1099

This Certificate Demonstrates That IIFL As An Organization Has Defined And Put In Place Best-Practice Information Security Processes.


