
Weekly Market Wrap – Volatility and Heavy FII Selling Dominated Headlines
In the week ended 20 March 2026, the NIFTY 50 held ground (declined only 0.16%). This was the fourth consecutive week of correction, though the pace was moderate. Volatility dominated the space, and there was a wide divergence in sectoral performances. Auto Stocks saw value buying and bottom fishing after the prior week’s 10% decline in the Nifty Auto Index. IT stocks also witnessed buying activity. Accenture’s healthy earnings were a key factor.
On the other hand, Banking stocks continued to decline. FMCG stocks also slid as inflation worries mount. Notably, NIFTY Pharma slid 1.2%. After a significant relative outperformance in the past 4 weeks, investors likely started to book profits in pharma stocks. There was no respite from the material correction in real estate stocks. They continued to slide as the NIFTY Realty index was down ~1.9%.
NIFTY 50 – Best Weekly Performance Since the Start of Middle East Tensions
Weekly Performance: -0.2%
| date | open | high | low | close |
| 2026-03-13 | 23462.5 | 23492.4 | 23112.0 | 23151.1 |
| 2026-03-16 | 23116.1 | 23502.0 | 22955.2 | 23408.8 |
| 2026-03-17 | 23493.2 | 23656.8 | 23346.6 | 23581.2 |
| 2026-03-18 | 23632.9 | 23862.2 | 23618.5 | 23777.8 |
| 2026-03-19 | 23197.8 | 23378.7 | 22930.3 | 23002.2 |
| 2026-03-20 | 23110.2 | 23345.2 | 23067.6 | 23114.5 |
Source: NSE
Figure: Recent performance
Source: NSE
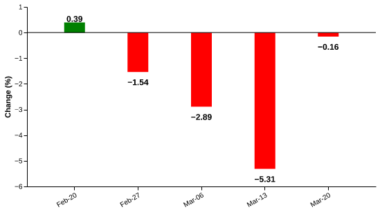
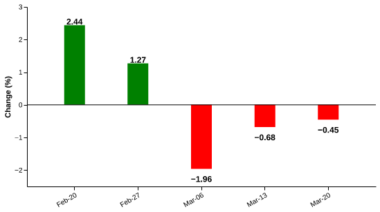
The NIFTY 50 declined 0.16% in the week ended 20 March 2026. The moderate decline is its best weekly performance since the start of the Middle East tensions. Weakness in heavyweight banking and financial stocks emerged as the key drag on the index, led by HDFC Bank (-4.44%), along with declines in ICICI Bank, Bajaj Finance, Shriram Finance, and Hindustan Unilever, which weighed significantly on overall sentiment. On the upside, a few stocks provided limited support, as Reliance Industries, Mahindra & Mahindra, Bharti Airtel, and Tata Steel posted gains that helped partially cushion the downside. However, the broader market remained range-bound, with 25 stocks advancing against 24 declining.
NIFTY MIDCAP SELECT – Slight Rebound and Continued Outperformance
Weekly Performance: 0.1%
| date | open | high | low | close |
| 2026-03-13 | 12884.6 | 12917.6 | 12579.5 | 12618.5 |
| 2026-03-16 | 12572.4 | 12701.4 | 12402.1 | 12615.2 |
| 2026-03-17 | 12681.8 | 12771.9 | 12577.7 | 12736.3 |
| 2026-03-18 | 12764.9 | 13039.5 | 12763.2 | 12980.5 |
| 2026-03-19 | 12751.5 | 12780.1 | 12454.0 | 12517.0 |
| 2026-03-20 | 12625.4 | 12769.9 | 12581.5 | 12625.9 |
Source: NSE
Figure: Recent performance
Source: NSE
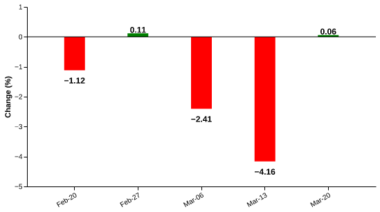
The NIFTY MIDCAP SELECT recorded a modest gain of 0.06% in the week ended 20 March 2026, snapping a two-week losing streak but indicating only a mild recovery. Gains were driven by select stocks such as Policybazaar (+3.53%), Indus Towers (+2.50%), Persistent Systems (+1.68%), Bharat Forge (+2.17%), and BHEL (+1.37%), which helped support the index. However, the upside was capped by sharp declines in Hindustan Petroleum (-8.80%), along with losses in Max Healthcare (-2.55%), Voltas (-5.82%), Colgate-Palmolive (-3.12%), and SRF (-1.84%), which weighed on overall sentiment. Market breadth remained weak, with 11 stocks advancing against 14 declining.
NIFTY IT – Accenture’s Healthy Earnings Improved Sentiment
Weekly Performance: 0.4%
| date | open | high | low | close |
| 2026-03-13 | 29381.7 | 29508.4 | 28936.8 | 29071.3 |
| 2026-03-16 | 28934.6 | 29202.7 | 28586.9 | 29042.6 |
| 2026-03-17 | 29080.8 | 29080.8 | 28288.1 | 28760.9 |
| 2026-03-18 | 28912.1 | 30055.6 | 28912.1 | 29559.3 |
| 2026-03-19 | 29141.9 | 29321.8 | 28477.5 | 28579.6 |
| 2026-03-20 | 28993.0 | 29322.4 | 28844.4 | 29199.6 |
Source: NSE
Figure: Recent performance
Source: NSE
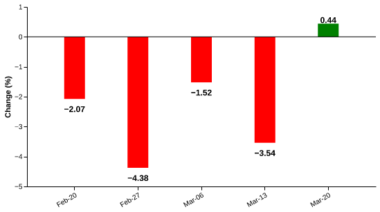
The NIFTY IT index edged up 0.44% in the week ended 20 March 2026, breaking a four-week losing streak and indicating an early sign of stabilisation in the IT sector. The upside was led by Tech Mahindra (+3.90%), with additional support from Infosys (+0.44%), Persistent Systems (+1.68%), HCLTech, and OFSS, which helped lift the index. However, gains were limited by declines in Wipro (-3.38%), TCS (-0.83%), Mphasis, and Coforge, which capped the overall upside. Market breadth remained relatively balanced, with 5 stocks advancing against 4 declining, suggesting a cautious improvement in sentiment following recent weakness.
NIFTY BANK – Corrective Phase Continues
Weekly Performance: -0.6%
| date | open | high | low | close |
| 2026-03-13 | 54592.1 | 54713.8 | 53675.7 | 53757.8 |
| 2026-03-16 | 53721.5 | 54664.2 | 53258.2 | 54413.4 |
| 2026-03-17 | 54649.1 | 54996.0 | 54113.2 | 54876.0 |
| 2026-03-18 | 54927.1 | 55554.2 | 54689.1 | 55326.1 |
| 2026-03-19 | 53474.6 | 54150.3 | 53240.6 | 53451.0 |
| 2026-03-20 | 53548.2 | 54382.4 | 53297.6 | 53427.1 |
Source: NSE
Figure: Recent performance
Source: NSE
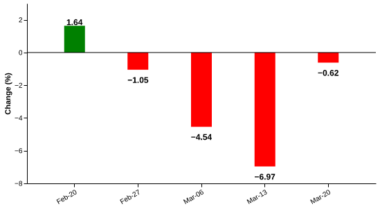
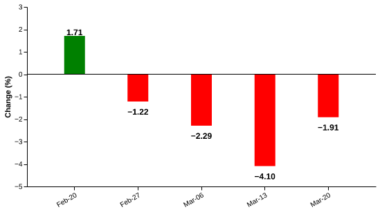
The NIFTY BANK index slipped 0.62% in the week ended 20 March 2026, extending its recent downtrend for the fourth straight week, though the pace of decline moderated compared to the sharper losses seen in previous weeks. The decline was led by heavyweight banks, with HDFC Bank (-4.44%) and ICICI Bank (-0.75%) weighing significantly on the index. On the upside, a few banks provided limited support, as State Bank of India, Federal Bank, AU Small Finance Bank, Axis Bank, and Canara Bank posted modest gains that helped partially cushion the downside. However, overall sentiment remained subdued, with 7 stocks advancing against 7 declining.
NIFTY ENERGY – Winners and Losers Witness Significant Moves
Weekly Performance: -0.5%
| date | open | high | low | close |
| 2026-03-13 | 36922.4 | 37116.6 | 35996.1 | 36071.9 |
| 2026-03-16 | 36101.9 | 36317.2 | 35258.5 | 35682.1 |
| 2026-03-17 | 35846.6 | 36087.0 | 35617.7 | 35980.8 |
| 2026-03-18 | 36065.9 | 36277.8 | 35969.1 | 36141.9 |
| 2026-03-19 | 35752.9 | 36137.4 | 35527.1 | 35639.4 |
| 2026-03-20 | 35914.6 | 36500.3 | 35851.1 | 35908.3 |
Source: NSE
Figure: Recent performance
Source: NSE
The NIFTY ENERGY index slipped 0.45% in the week ended 20 March 2026, continuing its recent downward bias and reflecting a loss of momentum after earlier gains. The fall was primarily driven by sharp corrections in Petronet LNG (-10.00%), Bharat Petroleum Corporation (-9.90%), Indian Oil Corporation (-7.70%), GAIL (India) (-3.30%), and CG Power and Industrial Solutions (-3.80%), which exerted notable pressure on the index. Meanwhile, select stocks offered some support, with Reliance Industries (+2.44%), Suzlon Energy (+1.30%), Power India, Adani Power, and JP Power (+18.00%) registering gains. Overall participation remained mixed, with 21 stocks advancing against 19 declining.
NIFTY FMCG – Slide Continues As Inflation Worries Mount
Weekly Performance: -1.9%
| date | open | high | low | close |
| 2026-03-13 | 48047.8 | 48642.9 | 47852.2 | 47924.1 |
| 2026-03-16 | 48005.9 | 48622.4 | 47826.4 | 48468.9 |
| 2026-03-17 | 48612.6 | 48612.6 | 48040.1 | 48104.4 |
| 2026-03-18 | 48215.4 | 48368.7 | 47997.0 | 48079.0 |
| 2026-03-19 | 47549.1 | 47914.6 | 46740.4 | 46861.9 |
| 2026-03-20 | 47321.9 | 47688.4 | 46925.4 | 47007.6 |
Source: NSE
Figure: Recent performance
Source: NSE
The NIFTY FMCG index declined 1.91% in the week ended 20 March 2026, extending its ongoing losing streak and reflecting persistent weakness across the sector. The decline was driven by sharp losses in key heavyweights, led by Hindustan Unilever (-3.58%), followed by Tata Consumer Products (-3.08%), Britannia (-3.27%), ITC (-0.50%), and Dabur (-5.03%), which collectively weighed heavily on the index. On the upside, Varun Beverages (+0.04%) was the only stock to register a marginal gain, offering limited support. Market breadth remained extremely weak, with 1 stock advancing against 14 declining.
NIFTY AUTO – Value Buying & Bottom Fishing Dominate The Sentiment
Weekly Performance: 2.2%
| date | open | high | low | close |
| 2026-03-13 | 24784.2 | 24918.2 | 24100.6 | 24195.1 |
| 2026-03-16 | 24085.9 | 24718.8 | 23863.4 | 24599.1 |
| 2026-03-17 | 24703.9 | 25195.4 | 24518.7 | 25117.1 |
| 2026-03-18 | 25262.2 | 25703.7 | 25250.8 | 25598.8 |
| 2026-03-19 | 25078.8 | 25093.2 | 24380.6 | 24509.9 |
| 2026-03-20 | 24635.8 | 24955.6 | 24611.3 | 24715.9 |
Source: NSE
Figure: Recent performance
Source: NSE
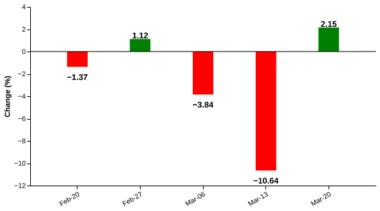
The NIFTY AUTO index recorded a gain of 2.15% in the week ended 20 March 2026, rebounding sharply after the steep decline in the previous week and signalling a recovery in the auto space. The rally was driven by Mahindra & Mahindra (+4.61%) and TVS Motor (+4.05%), along with gains in Bajaj Auto (+1.98%), Eicher Motors, and Tube Investments of India, which supported the index’s upward move. However, some stocks capped the gains, as MRF (-5.47%) and Balkrishna Industries (-5.42%) emerged as key laggards, while Motherson, Ashok Leyland, and Maruti Suzuki showed limited movement. Market breadth remained positive, with 10 stocks advancing against 4 declining.
NIFTY PHARMA – Profit Booking After Significant Relative Outperformance
Weekly Performance: -1.3%
| date | open | high | low | close |
| 2026-03-13 | 23198.8 | 23317.1 | 22780.7 | 22832.2 |
| 2026-03-16 | 22800.2 | 22965.2 | 22369.8 | 22547.2 |
| 2026-03-17 | 22632.8 | 22733.7 | 22492.9 | 22597.6 |
| 2026-03-18 | 22633.7 | 22774.8 | 22584.3 | 22632.6 |
| 2026-03-19 | 22413.1 | 22503.4 | 22040.6 | 22101.7 |
| 2026-03-20 | 22277.9 | 22628.6 | 22268.5 | 22540.7 |
Source: NSE
Figure: Recent performance
Source: NSE
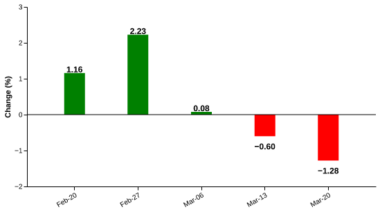
The NIFTY PHARMA index declined 1.28% in the week ended 20 March 2026, extending its recent weakness after a three‑week rally and signalling a reversal after the prior uptrend. The downside was led by losses in key heavyweights, including Cipla (-4.43%), Sun Pharma (-1.36%), Mankind (-6.49%), Torrent Pharma (-2.73%), and Alkem (-1.83%), which collectively dragged the index lower. On the positive side, select stocks such as Divi’s Laboratories, Granules India, Dr. Reddy’s Laboratories, Lupin, and Glenmark posted gains, offering limited support. However, overall sentiment remained weak, with 8 stocks advancing against 12 declining.
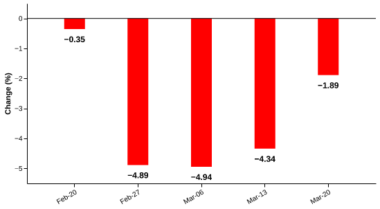
NIFTY REALTY – Bearish Phase Continues
Weekly Performance: -1.9%
| date | open | high | low | close |
| 2026-03-13 | 715.2 | 717.0 | 704.8 | 709.8 |
| 2026-03-16 | 710.4 | 711.2 | 685.0 | 698.6 |
| 2026-03-17 | 701.1 | 714.0 | 695.0 | 711.2 |
| 2026-03-18 | 711.3 | 735.6 | 708.9 | 730.8 |
| 2026-03-19 | 717.6 | 717.6 | 699.0 | 703.0 |
| 2026-03-20 | 707.6 | 717.1 | 694.9 | 696.4 |
Source: NSE
Figure: Recent performance
Source: NSE
The NIFTY REALTY index declined 1.89% in the week ended 20 March 2026, extending its downtrend for the fifth straight week, though the pace of decline eased compared to the sharper losses seen in recent weeks. The downside was primarily driven by a steep fall in Lodha (-8.02%), along with weakness in Godrej Properties, Phoenix Mills, Brigade Enterprises, and DLF, which collectively weighed on the index. On the upside, limited support came from Anant Raj (+3.52%) and Raymond (+5.06%), which posted gains but failed to offset broader losses. Market breadth remained weak, with 2 stocks advancing against 8 declining.
Related Tags
![]() IIFL Customer Care Number
IIFL Customer Care Number
(Gold/NCD/NBFC/Insurance/NPS)
1860-267-3000 / 7039-050-000
![]() IIFL Capital Services Support WhatsApp Number
IIFL Capital Services Support WhatsApp Number
+91 9892691696
Download The App Now
Follow us on
2026, IIFL Capital Services Ltd. All Rights Reserved
IIFL Capital Services Limited - Stock Broker SEBI Regn. No: INZ000164132 (Member ID - NSE: 10975 BSE: 179 MCX: 55995 NCDEX: 01249), DP SEBI Reg. No. IN-DP-185-2016, PMS SEBI Regn. No: INP000002213, IA SEBI Regn. No: INA000000623, Merchant Banker SEBI Regn. No. INM000010940, RA SEBI Regn. No: INH000000248, BSE Enlistment Number (RA): 5016, AMFI-Registered Mutual Fund Distributor & SIF Distributor
ARN NO : 47791 (Date of initial registration – 17/02/2007; Current validity of ARN – 08/02/2027), PFRDA Reg. No. PoP 20092018, IRDAI Corporate Agent (Composite) : CA1099

This Certificate Demonstrates That IIFL As An Organization Has Defined And Put In Place Best-Practice Information Security Processes.


