

Net inflows into equities surged by INR 110.6 billion last week. Notably, inflows into debt also improved after witnessing an outflow in the prior week. Combinedly, these have resulted in a total net inflow of INR 122.23 billion in the previous week. In contrast, YTD has witnessed a strong FII outflow of INR 4122 billion, primarily due to outflows from equity markets.
FPI flows for the week
This week’s FII inflow was a significant positive, at INR 122.23 billion. About 90% of this inflow was towards the equity market, with INR 101.03 billion coming into secondary equity. The IPO space saw a positive flow, which further indicated the robust demand for new issuances, with the primary markets receiving INR 9.52 billion. The debt market witnessed a modest inflow of INR 10.76 billion, as inflows into the hybrid and AIF categories were relatively tepid. Together, the data points to a net positive FII inflow this week and reiterates the positive trend of the past few weeks.
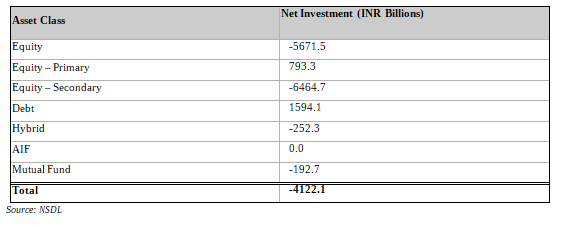
Figure: YTD FPI/FII flows for the week ending 2025-06-20
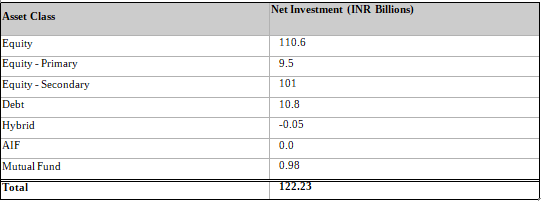
Source: NSDL
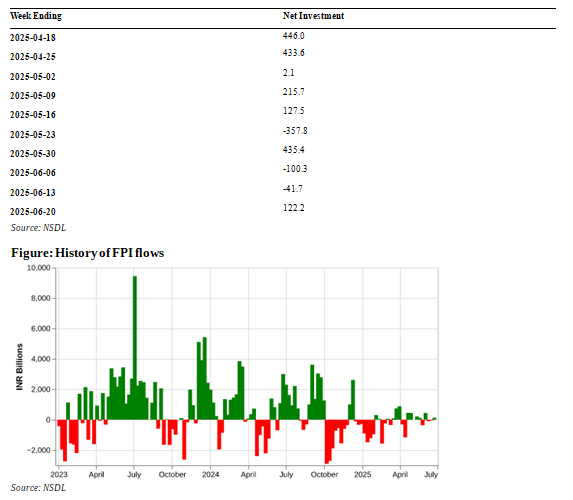
A weekly history of FPI flows:
The FII/FPI net investment of INR 122 billion over the last week is significantly above the year-to-date average of INR -194 billion, but still below the long-term average of INR 553 billion. Compared to the previous two weeks that saw a combined FII outflow of INR 142 billion, last week marked a reversal and witnessed an FII inflow.
Figure: Recent history of FPI flows
A weekly history of FPI flows in Equity:
The latest week’s FII/FPI net investment of INR 110 billion is below the long-term average weekly net investment of INR 258 billion, but above the year-to-date average weekly net investment of INR -244 billion. This was the second consecutive week of net FII inflows and indicates a modest improvement from the volatile FII flow sseen over teh past five weeks and even YTD.

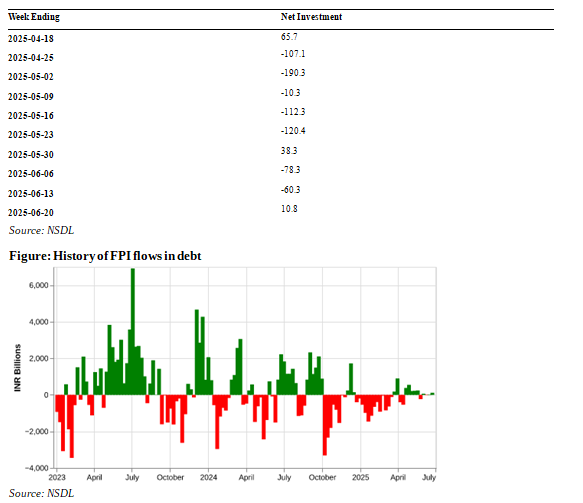
A weekly history of FPI flows in Debt:
The INR 10.76 billion FPI investment in the past week is significantly lower compared to the INR 271.73 billion long-term average weekly FII/FPI net investment and INR 51.34 billion year-to-date average weekly FII/FPI net investment for 2025. However, this marks a reversal from the outflows seen over the previous two weeks. Also, 7 of the past 10 weeks had witnessed an FII outflow in debt markets.
Figure: Recent history of FPI flows in debt
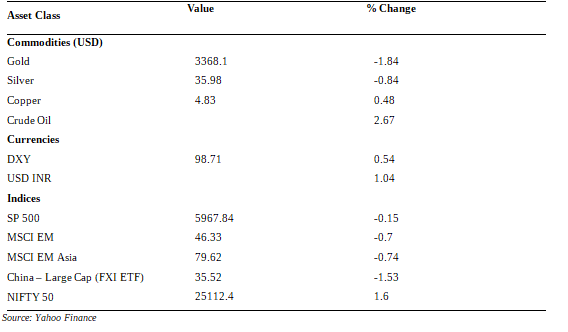
How have the major indices, currencies and commodities performed?
Over the past week, Gold and Silver lost some of their shine. Gold corrected 1.84% while Silver fell 0.84%. On the other hand, Crude Oil went up 2.67% on Israel-Iran tensions.
Amongst key markets, most Emerging Markets fell. China Large Caps fell sharply – by 1.53%. Both MSCI EM and MSCI EM Asia indices were down. On the other hand, Indian markets had a strong week as the NIFTY 50 was up 1.6%.
Figure: Performance of Key Indices, Currencies and Commodities
YTD FPI flows
Year-to-date (YTD) Foreign Institutional Investor (FII) inflows data indicates a mixed contour for Indian markets. The overall FII inflows is at -INR 4121.9 billion (net outflow), but there is an inflow worth INR 1594.07 billion in the debt segment, clearly showing foreign investors’ interest in Indian debt. The equity market has seen an outflow, to the tune of INR 5671.48 billion. Most of the outflow has happened at the begining of the year as investors booked profits. The situation has improved markedly in the later part of YTD with equities and even primary equities routinely witnessing net FII inflows.
Figure: YTD FPI/FII flows
Related Tags
![]() IIFL Customer Care Number
IIFL Customer Care Number
(Gold/NCD/NBFC/Insurance/NPS)
1860-267-3000 / 7039-050-000
![]() IIFL Capital Services Support WhatsApp Number
IIFL Capital Services Support WhatsApp Number
+91 9892691696
Download The App Now
Follow us on
2026, IIFL Capital Services Ltd. All Rights Reserved
IIFL Capital Services Limited - Stock Broker SEBI Regn. No: INZ000164132 (Member ID - NSE: 10975 BSE: 179 MCX: 55995 NCDEX: 01249), DP SEBI Reg. No. IN-DP-185-2016, PMS SEBI Regn. No: INP000002213, IA SEBI Regn. No: INA000000623, Merchant Banker SEBI Regn. No. INM000010940, RA SEBI Regn. No: INH000000248, BSE Enlistment Number (RA): 5016, AMFI-Registered Mutual Fund Distributor & SIF Distributor
ARN NO : 47791 (Date of initial registration – 17/02/2007; Current validity of ARN – 08/02/2027), PFRDA Reg. No. PoP 20092018, IRDAI Corporate Agent (Composite) : CA1099

This Certificate Demonstrates That IIFL As An Organization Has Defined And Put In Place Best-Practice Information Security Processes.


