

In a week that saw continued rally in US markets, Indian markets witnessed profit booking. FPIs sold their holdings in secondary market. Primary Equity witnessed inflows. FPI flows improved in debt for the third consecutive week. Overall, FPI flows continued to be positive. Separately, Gold and Silver rallied. Oil also recovered from the prior week’s plunge.
FPI flows for the week
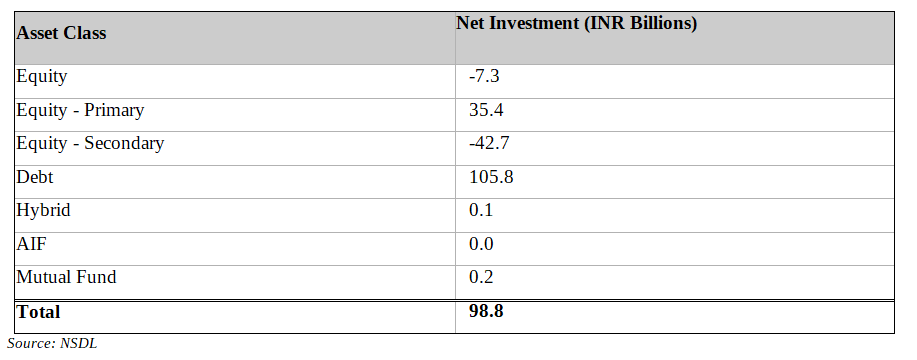
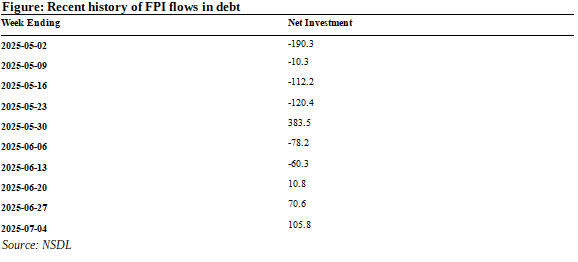
For the week ended 4 July 2025, overall FII inflows were positive at INR 98.8 billion. Debt markets continued to see inflows. Net debt inflows were at INR 105.8. However, equities witnessed a modest outflow of INR 7.29 billion. A closer look at equity inflows indicates a contrasting trend. While secondary market witnessed a significant outflow, it was partially offset by inflows via IPOs. INR 35.42 billion came in via primary and INR 42.71 billion was the outflow via secondary. Other categories like Hybrids and Mutual Funds also witnessed a modest inflow.
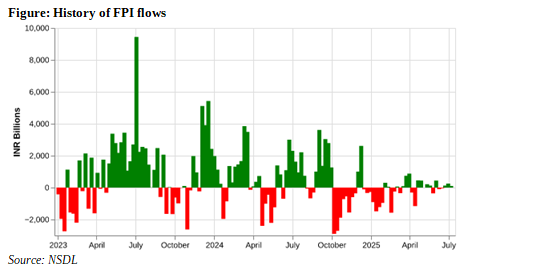
Figure: YTD FPI/FII flows for the week ending 2025-07-04
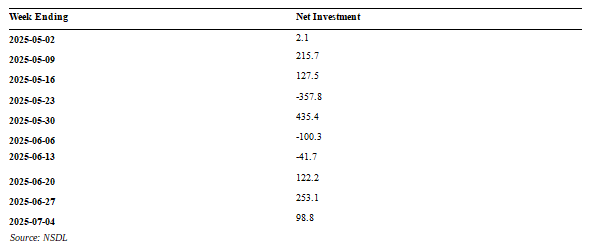
A weekly history of FPI flows:
The FII/FPI net investment over the past week of INR 98 billion is well above the year-to-date weekly average of INR -167 billion, but below the historical average of INR 547 billion. Relative to the past few weeks, the latest week’s inflows represent a slight moderation from the previous week’s INR 253 billion – the highest in the past five weeks. Overall, FPI inflows have been positive for 3 consecutive weeks and in 7 of the past 10 weeks.
Figure: Recent history of FPI flows
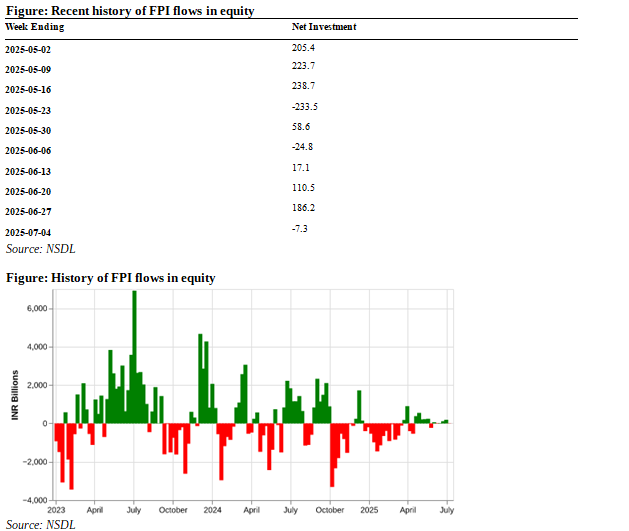
A weekly history of FPI flows in Equity:
The FII/FPI net investment for the last week was INR -7 billion. While they are still better than YTD weekly net flows of INR -219 bn, they are below long term average weekly net investment of INR 256 bn. Compared to the last few weeks, the latest week’s figure represents a turn of events as this is the first in four weeks that FII flows into equity were negative. Prior to this, net inflows had been rising steadily, to INR 186 billion in the week ending 30 June.
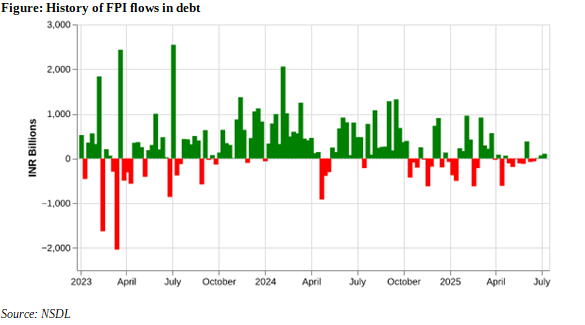
A weekly history of FPI flows in Debt:
FPI flows into debt continued to improve. In the week ended, 4 July 2025, FII flows into debt were INR 105 billion. While this is smaller than the long-term weekly average FII/FPI net investment of INR 268 billion, it is significantly above the year-to-date average of INR 54 billion. Also, there has been a continuous improvement over the past week weeks. They have been positive for 3 consecutive weeks. Prior to the current run of positive inflows, FIIs had been selling debt for much of the prior weeks (6 of the 7 weeks).
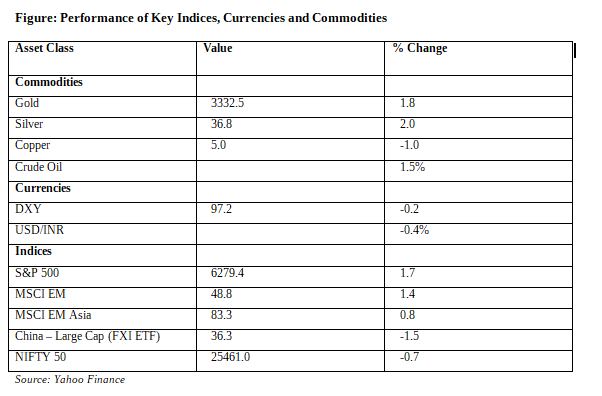
How have the major indices, currencies and commodities performed?
Last week saw a strong rally in US markets with S&P rallying by 1.7% and NASDAQ by 1.6%.While Emerging Markets followed suit with MSCI EM being up 1.39%, Indian large caps witnessed profit booking.
Precious Metals (Gold and Silver) rallied strongly. Gold was up 1.8% and Silver was up 2.05%. Copper was down 0.99%. Crude Oil recovered from prior week’s plunge and was up 1.5%.
Overall, the week continued to reflect the improved sentiment towards US equities and selective EM equities.
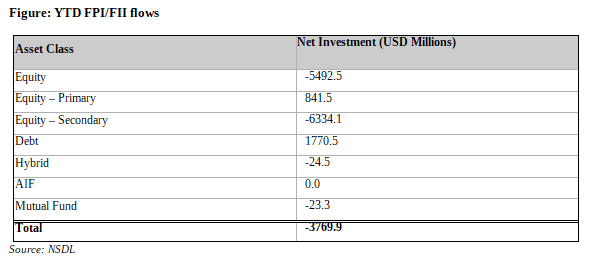
YTD FPI flows
The year-to-date (YTD) FII inflows chart suggests a mixed picture across asset classes. Overall, there was a net outflow of INR 3769.95 billion across asset classes. The worst hit has been the equity, which saw an outflow of INR 5492.55 billion, largely due to an outflow of INR 6334.08 billion from secondary equity market. The silver lining is the primary equity market, which has received INR 841.53 billion so far this year, suggesting an interest in new issuances. In addition, there has been an inflow in the debt side, to the tune of INR 1770.48 billion, showing a preference for fixed income. In sum, the FPI flows indicate a cautious stance towards Indian markets in the early part with an increasingly optimistic stance in the recent past.
Related Tags
![]() IIFL Customer Care Number
IIFL Customer Care Number
(Gold/NCD/NBFC/Insurance/NPS)
1860-267-3000 / 7039-050-000
![]() IIFL Capital Services Support WhatsApp Number
IIFL Capital Services Support WhatsApp Number
+91 9892691696
Download The App Now
Follow us on
2026, IIFL Capital Services Ltd. All Rights Reserved
IIFL Capital Services Limited - Stock Broker SEBI Regn. No: INZ000164132 (Member ID - NSE: 10975 BSE: 179 MCX: 55995 NCDEX: 01249), DP SEBI Reg. No. IN-DP-185-2016, PMS SEBI Regn. No: INP000002213, IA SEBI Regn. No: INA000000623, Merchant Banker SEBI Regn. No. INM000010940, RA SEBI Regn. No: INH000000248, BSE Enlistment Number (RA): 5016, AMFI-Registered Mutual Fund Distributor & SIF Distributor
ARN NO : 47791 (Date of initial registration – 17/02/2007; Current validity of ARN – 08/02/2027), PFRDA Reg. No. PoP 20092018, IRDAI Corporate Agent (Composite) : CA1099

This Certificate Demonstrates That IIFL As An Organization Has Defined And Put In Place Best-Practice Information Security Processes.


