

In a week that saw a sharp rally across commodities and continued rally in Tech heavy indices, Indian markets corrected and FII flows turned negative. FIIs sold their holdings in secondary market equity and debt. On the other hand, Primary market equity continues to be a bright spot and witness FII inflows.
FPI flows for the week
For the week ending 11th July 2025, FIIs sold secondary equities and debt. However, IPOs continue to attract interest. Overall, there was a net FII withdrawal of INR 13.51 billion. For Primary Equity, there was an inflow of INR 12.77 billion, while Secondary Equity posted an outflow of INR 12.05 billion, probably due to profit-booking. The Hybrid category witnessed an outflow of INR 4.07 billion. Debt, on the other hand, witnessed an outflow of INR 14.55 billion and Mutual Funds received an inflow of INR 4.39 billion. In summary, foreign investors were cautious, invested in IPOs while reducing secondary equity and debt exposure.
Figure: YTD FPI/FII flows for the week ending 2025-07-11
| Asset Class | Net Investment (INR Billions) |
| Equity | 0.7 |
| Equity – Primary | 12.8 |
| Equity – Secondary | -12.0 |
| Debt | -14.6 |
| Hybrid | -4.1 |
| AIF | 0.0 |
| Mutual Fund | 4.4 |
| Total | -13.5 |
Source: NSDL
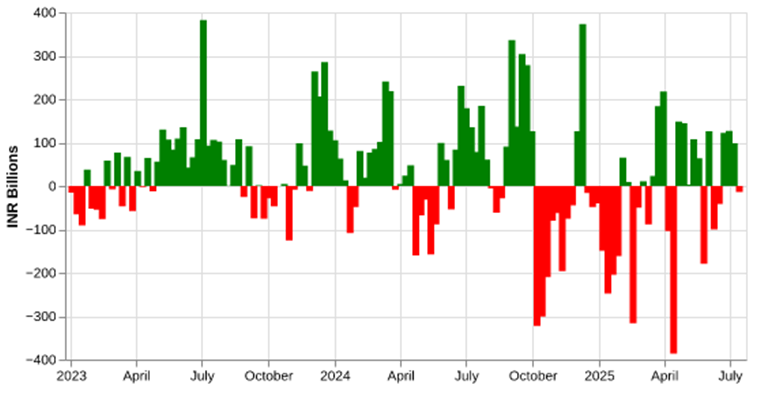
A weekly history of FPI flows:
Last week’s net FII/FPI investment of INR -13.5 billion is much lower compared to the average weekly net investment over the long term of INR 26.21 billion. However, it is above the YTD net weekly investment of INR -21.1 billion. Last week’s numbers also show a reversal of fortunes considering the net positive investment in the past 3 weeks at INR 122 billion, INR 126 billion and INR 99 billion, respectively
Figure: Recent history of FPI flows
| Week Ending | Net Investment |
| 2025-05-09 | 107.9 |
| 2025-05-16 | 63.7 |
| 2025-05-23 | -178.9 |
| 2025-05-30 | 126.5 |
| 2025-06-06 | -100.3 |
| 2025-06-13 | -41.7 |
| 2025-06-20 | 122.2 |
| 2025-06-27 | 126.6 |
| 2025-07-04 | 98.8 |
| 2025-07-11 | -13.5 |
Source: NSDL
Figure: History of FPI flows
Source: NSDL
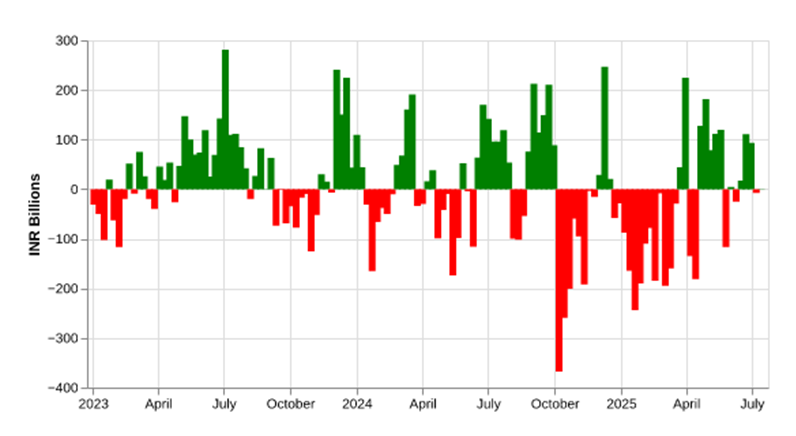
A weekly history of FPI flows in Equity:
The FII/FPI net investment of INR 0.7 billion in the last week is much lower than the 3Y weekly average of INR 7 billion. But, it is above the YTD weekly net investment average of INR -28 billion. The last week’s numbers are a continuation of lacklustre flows witnessed during the prior week. After two weeks of significant inflows (20th July and 27th June), FII inflows have turned negative or lacklustre. Indian markets fell and significantly underperformed the US markets during this time. An analysis of recent FPI flows also indicates that FII flows into equity were negative in only 3 of the past 10 weeks and in only 1 of the past 5 weeks.
Figure: Recent history of FPI flows in equity
| Week Ending | Net Investment (INR Billions) |
| 2025-05-09 | 111.9 |
| 2025-05-16 | 119.4 |
| 2025-05-23 | -116.7 |
| 2025-05-30 | 4.3 |
| 2025-06-06 | -24.8 |
| 2025-06-13 | 17.1 |
| 2025-06-20 | 110.5 |
| 2025-06-27 | 93.1 |
| 2025-07-04 | -7.3 |
| 2025-07-11 | 0.7 |
Source: NSDL
Figure: History of FPI flows in equity
Source: NSDL
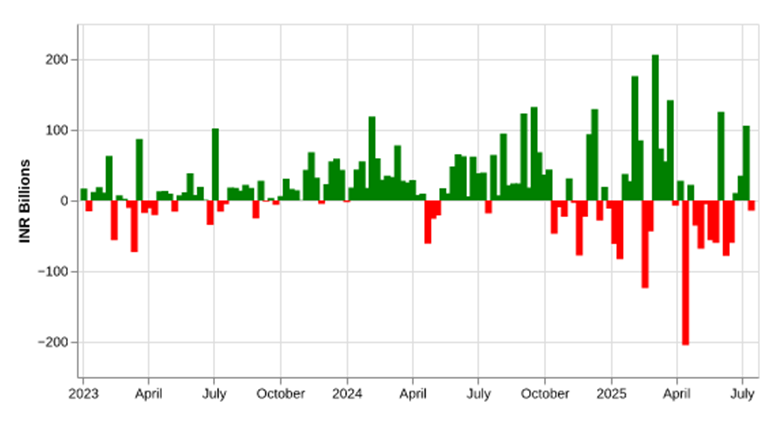
A weekly history of FPI flows in Debt:
FII’s had sold (net) INR 14.5 billion of debt last week. These flows are much below the historical average weekly FII/FPI net investment of INR 17 billion and the year-to-date average weekly FII/FPI net investment of INR 8 billion for 2025. The decrease (INR -14 billion) came after three successive weeks of positive FII flows into debt.
An analysis of recent history indicates that while FII flows into debt were better than FII flows into equity at the beginning of the year, they have been lackluster in the recent past. 6 of the past 10 weeks witnessed net FII outflows from debt.
Figure: Recent history of FPI flows in debt
| Week Ending | Net Investment (INR Billions) |
| 2025-05-09 | -5.1 |
| 2025-05-16 | -56.1 |
| 2025-05-23 | -60.2 |
| 2025-05-30 | 125.3 |
| 2025-06-06 | -78.2 |
| 2025-06-13 | -60.3 |
| 2025-06-20 | 10.8 |
| 2025-06-27 | 35.3 |
| 2025-07-04 | 105.8 |
| 2025-07-11 | -14.6 |
Source: NSDL
Figure: History of FPI flows in debt
Source: NSDL
How have the major indices, currencies and commodities performed?
Last week was dominated by significant moves across commodities. Crude Oil (+4.58%), Silver (+7.19%) and Copper (+10.18%) rallied strongly. Gold remained steady at 0.5%.
Equity markets, on the other hand, showed a mixed performance. Tech heavy Nasdaq (+1.89%) rallied strongly. S&P 500 (+0.99%) also followed suit. However, Dow Jones was down 0.28%. EMs underperformed significantly. MSCI EM Index was down 0.14%. While MSCI EM Asia was marginally up, it was due to the significant rally in Tech Heavy Taiwan and Korean Markets. Tech heavy KOSPI and TAIEX rallied 2.8% and 0.9% respectively. On the other hand, Nifty 50 was down 1.53% and Hang Seng was down -0.34%.
USD appreciated last week. DXY was up 1.06%.
Figure: Performance of Key Indices, Currencies and Commodities
| Asset Class | Value (USD) | % Change |
| Commodities | ||
| Gold | 3356.0 | 0.6 |
| Silver | 38.7 | 7.2 |
| Copper | 5.6 | 10.2 |
| Crude Oil | 4.58 | |
| Currencies | ||
| DXY | 97.8 | 1.1 |
| USD INR | 0.02 | |
| Indices | ||
| SP 500 | 6259.8 | 1.0 |
| MSCI EM | 48.3 | -0.1 |
| MSCI EM Asia | 82.9 | 0.2 |
| KOSPI | 3175.8 | 2.8 |
| TAIEX | 22751.0 | 0.9 |
| Hang Seng | 24139.6 | -0.3 |
| NIFTY 50 | 25149.8 | -1.5 |
Source: Yahoo Finance
YTD FPI flows
Year to date (YTD) FII flows provide mixed signals with significant divergence amongst different asset classes. Primary Equity witnessed a strong INR 268.1 billion of inflows. Secondary Equity suffered significant outflows amounting to INR 1 trillion. In aggregate, these led to a net outflow of INR 732.1 billion on the Equity front. Debt, on the other hand, has received robust INR 277.7 billion as inflows. The total net outflow of INR 468.8 billion is dominated by the large outflows in Secondary Equity. Mutual Fund and Hybrid categories have witnessed slight outflows too. In all, the data indicates that FIIs have adopted a cautious stance with a preference for debt over equity, and have been net sellers on the secondary equity market.
Figure: YTD FPI/FII flows
| Asset Class | Net Investment (INR Billions) |
| Equity | -732.1 |
| Equity – Primary | 268.1 |
| Equity – Secondary | -1000.1 |
| Debt | 277.7 |
| Hybrid | -13.9 |
| AIF | 0.0 |
| Mutual Fund | -0.4 |
| Total | -468.8 |
Source: NSDL
Related Tags
![]() IIFL Customer Care Number
IIFL Customer Care Number
(Gold/NCD/NBFC/Insurance/NPS)
1860-267-3000 / 7039-050-000
![]() IIFL Capital Services Support WhatsApp Number
IIFL Capital Services Support WhatsApp Number
+91 9892691696
Download The App Now
Follow us on
2026, IIFL Capital Services Ltd. All Rights Reserved
IIFL Capital Services Limited - Stock Broker SEBI Regn. No: INZ000164132 (Member ID - NSE: 10975 BSE: 179 MCX: 55995 NCDEX: 01249), DP SEBI Reg. No. IN-DP-185-2016, PMS SEBI Regn. No: INP000002213, IA SEBI Regn. No: INA000000623, Merchant Banker SEBI Regn. No. INM000010940, RA SEBI Regn. No: INH000000248, BSE Enlistment Number (RA): 5016, AMFI-Registered Mutual Fund Distributor & SIF Distributor
ARN NO : 47791 (Date of initial registration – 17/02/2007; Current validity of ARN – 08/02/2027), PFRDA Reg. No. PoP 20092018, IRDAI Corporate Agent (Composite) : CA1099

This Certificate Demonstrates That IIFL As An Organization Has Defined And Put In Place Best-Practice Information Security Processes.


