
Will RBI continue the rate cuts or stick to its ‘neutral’ stance?
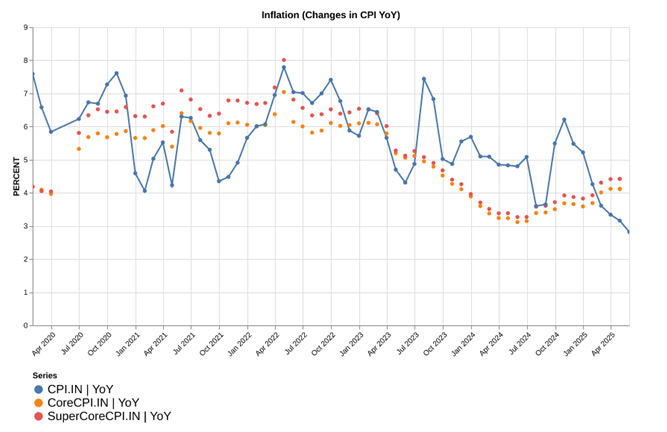
Headline CPI inflation dropped further. It went below 3% to 2.8% for the first time in five years. However, a deeper analysis reveals that the Core and Supercore components remained sticky. Core and Super Core CPI, which exclude more volatile components such as food, fuel and housing, have stayed stubbornly above 4%, signaling intransigent price pressures. Though food and energy inflation has eased dramatically, underlying drivers of inflation — including increased prices of miscellaneous services — indicate that latent demand-side firmness has persisted. After the jumbo rate cut by RBI, analysts see the core inflation as continuing to remain sticky. This continues to present a tough challenge for policymakers.
Headline CPI drops further. Core CPI holds fort
India’s Headline CPI declined further. It fell below 3% to 2.82%. These are the lowest levels seen since covid. This is also below median expectations of ~3%. However, core CPI and Supercore CPI have been stable.
Key Observations:
Headline CPI Inflation Falls: CPI inflation has shown a sharp declining trend. The latest CPI is the lowest in 5 years. This decrease can be mostly associated with the decrease in volatile components, such as food and fuel prices.
Core CPI Remains Stable: On the other hand, Core CPI (ex Food & Energy) has continued to be more stable, suggesting underlying inflationary forces have not completely diminished.
Super Core CPI Trends: Super Core CPI – which also leaves out housing, on top of food and energy – continues to be steady.
The higher Core and Supercore CPI inflation (at around 4%) has implications for monetary policy. RBI had announced a surprising rate cut of 50bps in its recent MPC meeting. However, the fall in inflation seems likely related to easing of supply chain pressures, food prices and influx of cheaper goods. This has also likely been the reason for RBI changing its stance from accommodative to neutral. In summary, policymakers may have to walk the tightrope of balancing the need to support economic growth while keeping inflationary pressures in check.
Source: MOSPI
Disaggregating CPI Components: A Mixed Bag
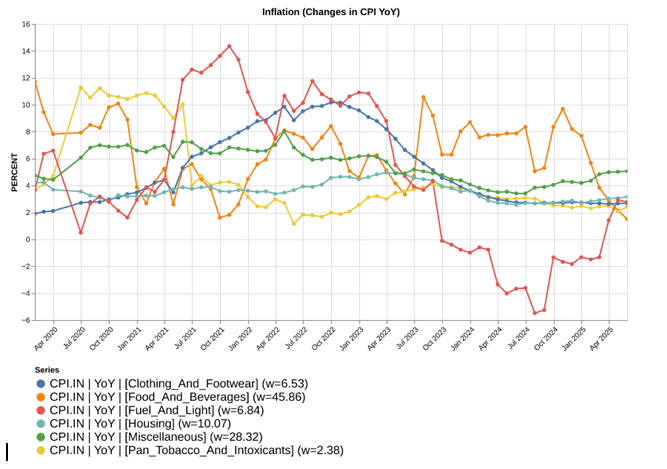
The following chart shows inflation for key components of CPI. The main categories taken in consideration are Clothing and Footwear; Food and Beverages; Fuel and Light; Housing; Miscellaneous; and Pan/Tobacco/Intoxicants.
Key Observations:
Food & Beverage (45.86% weight): This is the category that has the highest weight in CPI. After being persistently high during 2022-24, it has fallen sharply in the past year. More so, in the past 3 months. This has been a significant factor in pulling down the overall inflation. Timely monsoon and good harvests are some of the reasons behind the fall in food prices.
Housing (10.07% weight): Housing has seen only mild inflation in the past year. After falling from moderately high levels in 2023, it has been stable at ~3%.
Fuel and Light (6.84 % weight): This has been the most volatile component of inflation. After being negative for most of 2024, it has increased to ~3% now.
Clothing and Footwear (Weight 6.53%): Inflation in this category hit around 10% in late 2021 and early 2022. It has been falling since then and is settling at about 3% for 2024-2025.
Miscellaneous (28.32% weight): This broad category has seen inflation rise from ~4% at the beginning of 2021 to ~8% in mid-2022. After moderating, it has started to increase and is a driver of headline CPI.
Source: MOSPI
Food and Beverages Inflation: Major Drivers and Trend
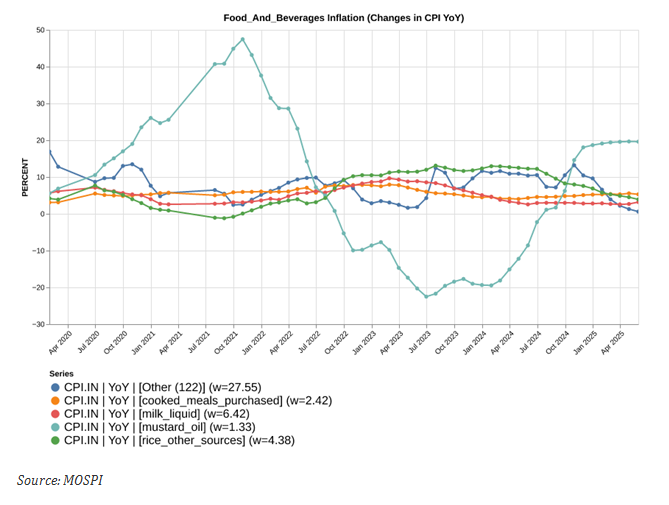
The following chart shows the inflation of various components in the Food & Beverages category, which represents an important component of the overall Consumer Price Index (CPI).
Key Observations
Mustard Oil (1.33%): It is the most volatile component, with inflation ranging from 45% in late 2021 to -20% in early 2023. It has since rebounded to about 20%, as of the latest data point. Its weight in the CPI is 1.33%, but its volatility has an outsized impact on the category.
Rice (4.4%): Has moderated significantly over the past year. Its inflation has decreased from a peak of 10%+ last year to ~5% now.
Milk (6.4%): Milk has had relatively low inflation, with inflation rates below 3% over the past year. The recent release shows that it has inched up above 3%.
Other (27.55%): This has been a key contributor to the falling inflation. Inflation in the aggregation of all remaining foods and beverages products has almost disappeared. Its latest inflation print is 0.6% – lowest in the past 5 years.
Source: MOSPI
Clothing and Footwear: Major Drivers and Trend
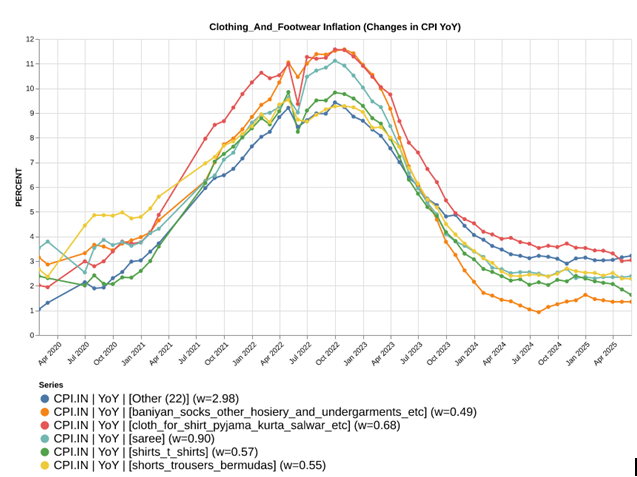
The following chart represents the year-over-year (YoY) change of various subcategories within the Clothing and Footwear category. The data indicates an wave of inflation in all subcategories until early 2022, followed by a significant moderation.
Key Observations
All the subcategories had experienced a synchronized increase in the inflation rate from second half of 2021 through late 2022 reaching 10-12%. There was a deceleration in inflation rates in all subcomponents in the months to follow, suggesting a normalization of supply chains and a deceleration in demand.
Synchronized Inflation Surge: All of segments posted high inflation in 2022. Supply chains struggled to cope with the demand post covid and were a key reason for the inflation.
Post‐Peak Decline: After the peak in end‐2022, rates of inflation in all the subcategories fell, some by more than others. This fall indicates normalization of the supply chains and moderate demand.
Source: MOSPI
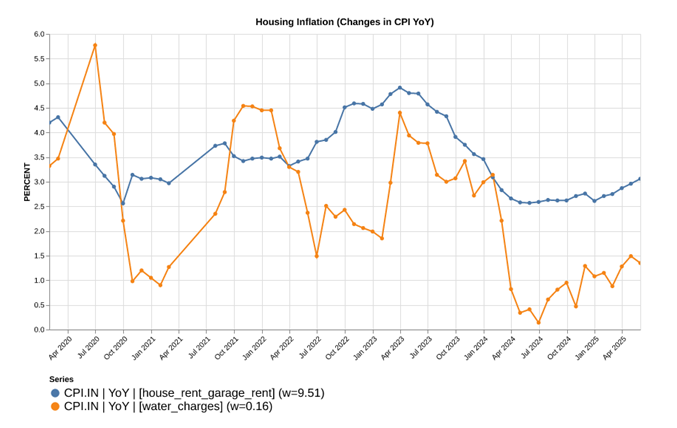
Housing: Major Drivers and Trend
The following chart plots the YoY changes in housing inflation using the two key sub-items
Key Observations
House Rent Inflation: House rent inflation has started to increase. While it declined from a peak of 5% in April 2023, it bottomed out at 2.5% and has increased to 3% now.
Source: MOSPI
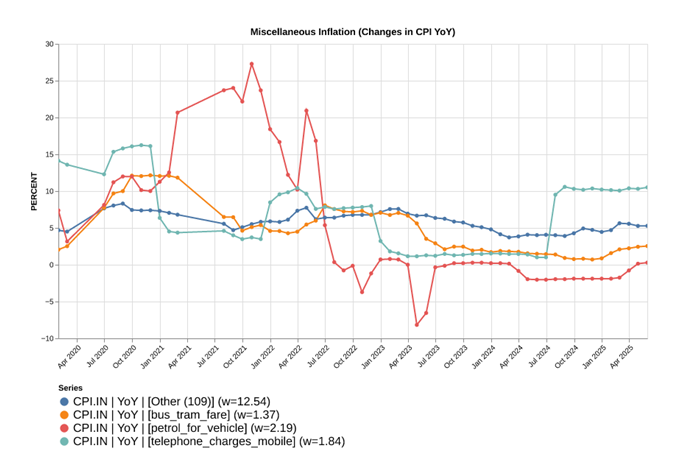
Miscellaneous Items – A Significant Contributor to Core Inflation:
The table accompanying the chart displays YoY contribution of the selected elements of miscellaneous inflation.
Key Observations:
Mobile Bills on the Rise: Mobile Telephony costs are also sharply up YoY. They account for ~2% of overall inflation and were up 10% YoY.
Moderating ‘others’ inflation: While there has been an overall pickup in inflation across various items as evidenced by the ‘others’ line, it has stabilised. For the past three months, it has been relatively high but stable at 5.25%.
Petrol: Petrol for vehicle inflation, which had shot up in 2021-22, had crashed and was negative till recently. It has inched up to a positive territory now.
Source: MOSPI
Related Tags
![]() IIFL Customer Care Number
IIFL Customer Care Number
(Gold/NCD/NBFC/Insurance/NPS)
1860-267-3000 / 7039-050-000
![]() IIFL Capital Services Support WhatsApp Number
IIFL Capital Services Support WhatsApp Number
+91 9892691696
Download The App Now
Follow us on
2026, IIFL Capital Services Ltd. All Rights Reserved
IIFL Capital Services Limited - Stock Broker SEBI Regn. No: INZ000164132 (Member ID - NSE: 10975 BSE: 179 MCX: 55995 NCDEX: 01249), DP SEBI Reg. No. IN-DP-185-2016, PMS SEBI Regn. No: INP000002213, IA SEBI Regn. No: INA000000623, Merchant Banker SEBI Regn. No. INM000010940, RA SEBI Regn. No: INH000000248, BSE Enlistment Number (RA): 5016, AMFI-Registered Mutual Fund Distributor & SIF Distributor
ARN NO : 47791 (Date of initial registration – 17/02/2007; Current validity of ARN – 08/02/2027), PFRDA Reg. No. PoP 20092018, IRDAI Corporate Agent (Composite) : CA1099

This Certificate Demonstrates That IIFL As An Organization Has Defined And Put In Place Best-Practice Information Security Processes.


