

The sharp drop in headline CPI inflation to 3.16% (well under the RBI’s 4% target) could imply scope for policy easing. But there is a more nuanced picture beneath the surface. Core and Super Core CPI, which exclude more volatile components such as food, fuel and housing, have stayed stubbornly above 4%, signaling intransigent price pressures. Though food and energy inflation has eased dramatically, underlying drivers of inflation — including increased prices of miscellaneous services — indicate that latent demand-side firmness has persisted. For policymakers, the situation presents a difficult trade-off. The dichotomy between the headline and core inflation has presented a conundrum for the RBI – whether to react to the sharp disinflation in the headline or continue to be attentive to the stubbornness of the core price pressures.
Headline Inflation drops. But Core Inflation remains steady:
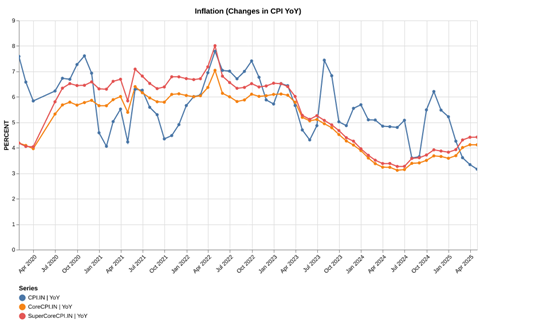
When MOSPI released inflation data last week, the contrast was evident. Headline CPI continued to fall while the Core CPI and Super Core CPI remained steady. Core CPI excludes volatile components like Food and Fuel. Super Core CPI, in addition to those, excludes Housing costs too.
Key Observations:
Headline CPI Inflation Comes Down Sharply: As recently as last October, CPI had breached RBI’s threshold level of 6% and had touched 6.21%. The latest print shows that it has come down sharply and has gone below RBI’s usual target of 4%. The latest CPI of 3.16% is the lowest in years.
Core CPI and Super Core CPI Inflation Have Inched Up: On the contrary, non-volatile or more stable measures of Inflation had notched up. A quick analysis shows that they have indeed crossed the 4% threshold.
Figure: Key Trends in CPI
Source: MOSPI
What’s Driving CPI – A Study in Contrasts
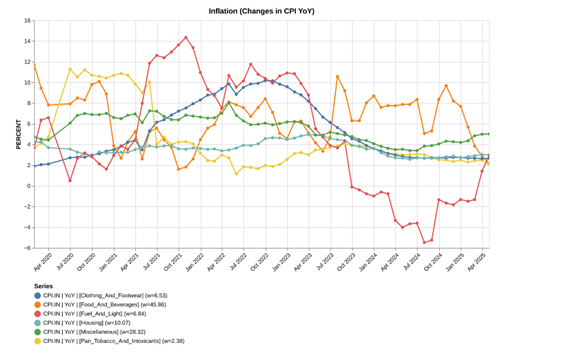
The following chart shows the year-over-year (YoY) increases to the Consumer Price Index (CPI) of different groups within CPI from April 2020 to April 2025. The key categories are Clothing and Footwear, Food and Beverages, Fuel and Light, Housing, Miscellaneous, and Pan/Tobacco/Intoxicants.
Key Observations:
Fuel and Light (Energy): The increasing price of oil has resulted in a sharp increase in this component over the past year. However, as geopolitical tensions ease and oil price moderates, moderation is likely in store.
Housing: Shows an upward trajectory between 2020 and 2022 with a peak of about 10% YoY. The rate of inflation has slowly been decreasing ever since, hovering between 2-3% in 2024-2025. However, it has started to inch up recently.
Food and Beverages: Experienced a spike in inflation and remained persistently high during 2023-24. This was followed by a sharp decline as supply side challenges eased.
Apparel & Footwear: It is interesting to note that inflation peaked at somewhere around 9% YoY during 2022-23. The rate has been falling ever since, roughly steadying at about 2-3% in 24-25.
Miscellaneous: Inflation increased from sub-4% to between 5%+ in the past few months. This has been among the key components driving up the Core CPI.
Figure: Drivers of CPI
Source: MOSPI
Inflation in Food Beverages – Largest Component of CPI
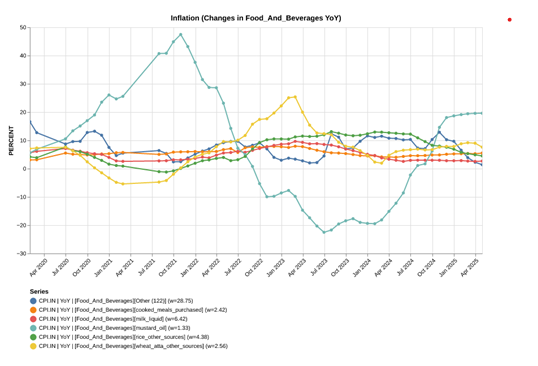
The following chart visualizes the year on year (YoY) change in inflation of some of the components of Food and Beverages. The data indicates some interesting patterns and variations for the five largest categories.
Key Observations
When you look at broader Food and Beverages inflation it has fallen sharply over the past year.
Milk, Rice & Atta: The three largest items in this category have shown sharply lower inflation over the past year. Better rain has led to a bumper harvest in rice and contributed to the overall fall in inflation. Inflation in milk has remained below 2.75% for the past 3 months.
Mustard oil: Mustard Oil is a top 5 item by weight. Its prices are volatile and have increased sharply. As per the latest data, they have inflation in mustard oil is ~20%.
So, while the Food and Beverages inflation in general is on a declining path, select items like mustard oil have seen sharp increase in inflation.
Figure: Drivers of Food and Beverage Inflation
Source: MOSPI
Inflation in Clothing and Footwear – Lower for Longer?
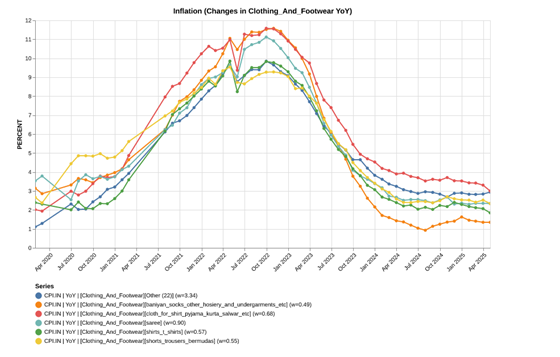
The chart below shows the year-over-year (YoY) changes for inflation for the various subcategories in the Clothing and Footwear category. The data shows parallel trends of increase in all subcategories till early 2021-end Sept 2022 and then a significant decline.
Key Observations
Synchronized Inflation Surge: All of segments posted high inflation in 2022. Supply chains struggled to cope with the demand post covid and were a key reason for the inflation.
Post‐Peak Decline: After the peak in end‐2022, rates of inflation in all the subcategories fell, some by more than others. This fall indicates normalization of the supply chains and moderate demand.
Figure: Drivers of Apparel Inflation
Source: MOSPI
Inflation in Housing – Inching Up
The figure shows the YoY inflation in components related to housing, and it offers a glimpse of the behavior and determinants of housing inflation.
Key Observations
House Rent: House rent inflation shows a somewhat stable pattern but rising slowly from about 2.5% in mid of last year to nearly 3% now. Still, this is modest and has a mild impact on headline inflation.
Cost of repairs: While this is a minor component of inflation, it has surged strongly. Cost of repairs had reached levels close to 8% in late 2022 and even during covid years of 2021. Now, it has crossed 6%.
Figure: Drivers of Housing Inflation
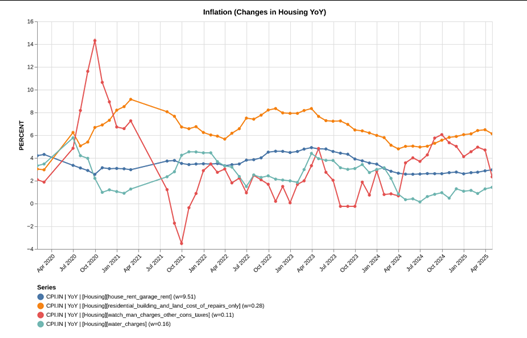
Source: MOSPI
Miscellaneous Items – A Significant Contributor to Core Inflation
This chart shows the YoY trends in selected miscellaneous categories component. Of late, this category has been a material source of inflation as it has inched up to 5%.
Key Observations:
Broadbased Pickup In Inflation: There has been an overall pickup in inflation across various items as evidenced by the ‘others’ line. After hovering at less than 5% for a long period of time, it has inched up to more than 5% now.
Mobile Bills on the Rise: Mobile Telephony costs are also sharply up YoY. They account for ~2% of overall inflation and were up 10% YoY.
Figure: Drivers of Miscellaneous Inflation
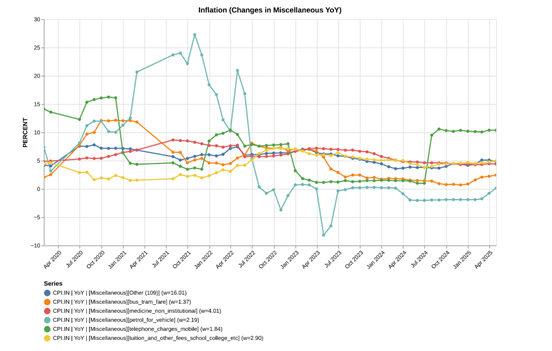
Source: MOSPI
Related Tags
![]() IIFL Customer Care Number
IIFL Customer Care Number
(Gold/NCD/NBFC/Insurance/NPS)
1860-267-3000 / 7039-050-000
![]() IIFL Capital Services Support WhatsApp Number
IIFL Capital Services Support WhatsApp Number
+91 9892691696
Download The App Now
Follow us on
2026, IIFL Capital Services Ltd. All Rights Reserved
IIFL Capital Services Limited - Stock Broker SEBI Regn. No: INZ000164132 (Member ID - NSE: 10975 BSE: 179 MCX: 55995 NCDEX: 01249), DP SEBI Reg. No. IN-DP-185-2016, PMS SEBI Regn. No: INP000002213, IA SEBI Regn. No: INA000000623, Merchant Banker SEBI Regn. No. INM000010940, RA SEBI Regn. No: INH000000248, BSE Enlistment Number (RA): 5016, AMFI-Registered Mutual Fund Distributor & SIF Distributor
ARN NO : 47791 (Date of initial registration – 17/02/2007; Current validity of ARN – 08/02/2027), PFRDA Reg. No. PoP 20092018, IRDAI Corporate Agent (Composite) : CA1099

This Certificate Demonstrates That IIFL As An Organization Has Defined And Put In Place Best-Practice Information Security Processes.


