
In as week that saw a risk off sentiment due to geopolitical tensions, FIIs trimmed debt but invested in IPOs. FII flows into equity markets have improved since April. However, they remain negative YTD. On the other hand, debt provides a contrasting picture. While they are healthy YTD, they have deteriorated of late.
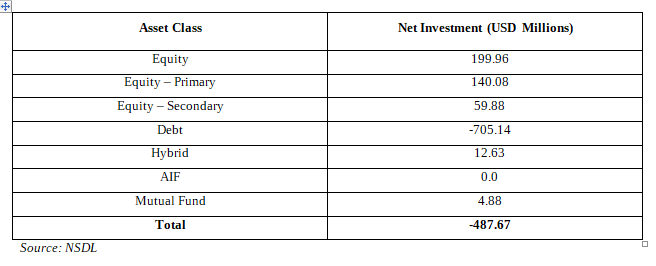
FPI flows for the week ended 13 June 2025
The FII flows for the week present a contrasting picture. While they improved in the equity asset class, debt continues to witness outflows. Debt saw a substantial outflow of USD705.14 million, as higher US interest rates and a stronger dollar have likely made domestic debt less appealing to overseas investors. Meanwhile, the equities category witnessed a notable inflow of USD 199.96 million, contributed by inflows into primary market transactions (includes IPOs) of USD 140.08 million in the week. Smaller segments like the Mutual Fund and Hybrid categories also attracted modest flows. On the whole, though the debt outflows are a worry, the equity inflows do offer a silver lining, and the FII inflows for the week could be called cautiously positive.
Figure: YTD FPI/FII flows for the week ending 2025-06-13
Two consecutive weeks of FPI outflow:
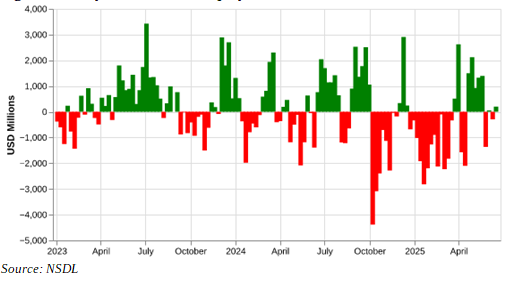
The FPI data for the most recent week is well below the long-term average weekly FII/FPI net inflow of USD 298 million. It is also below the YTD net inflow of USD -444 million. Historically, FII flows have been volatile on a week to week basis and weekly flows offer little insight. However, it is interesting to note that after positive FII flows during most of April and early May, they have turned sharply negative with 3 out of past 4 weeks witnessing a negative outflow.
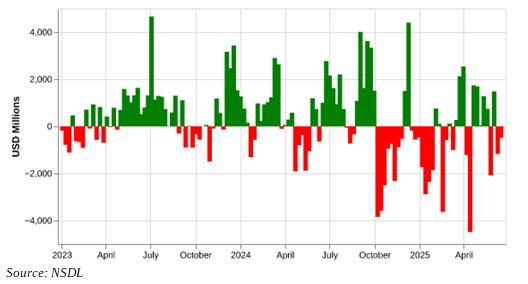
Figure: Recent history of FPI flows
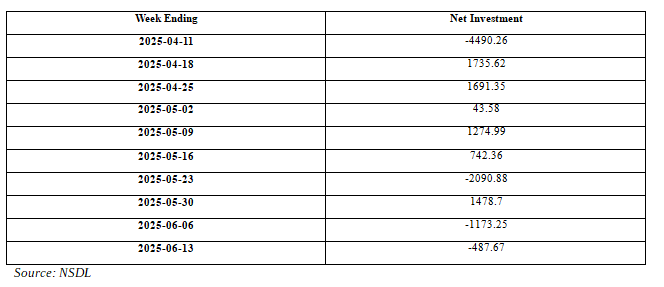
Figure: History of FPI flows
FII flows into equities continues to recover:
During a week marked by major geopolitical events – Israel-Iran attack and Us-China Trade talks, Indian markets saw positive inflows into equities by FIIs. FII/FPI net investment for the week at USD 199 million is above the YTD figure of USD -476 million but below the long-term average of USD 75 million. While YTD, FIIs have sold Indian equities heavily, the situation has markedly improved since April. 7 of the past 10 weeks have witnessed FIIs buying Indian equities.
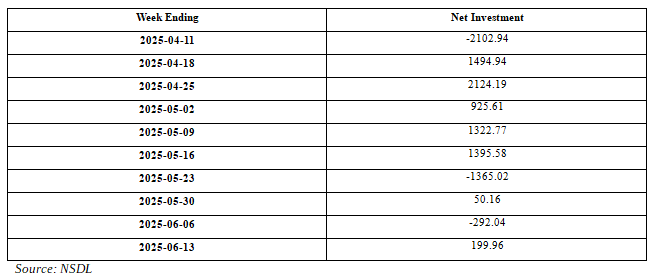
Figure: History of FPI flows in equity
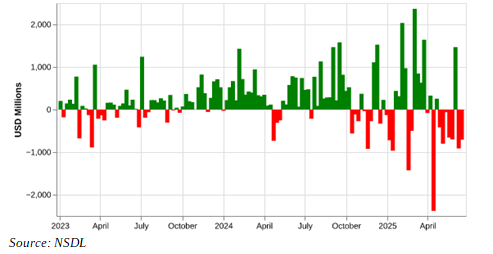
FIIs have sold debt for 8 out of 10 weeks
The FPI figure for the week, at USD -705 million, is significantly below both the long-term average weekly FII/FPI net investment of USD 208 million and the year-to-date average weekly FII/FPI net investment of USD 39 million. Seen in light of the previous few weeks, this week’s FII/FPI net investment continues the trend of predominantly negative net investments, with four out of the last five weeks showing outflows. The only exception was the week ending 2025-06-02, which saw a significant inflow of USD 1465.36 million. However, this was followed by a strong bounceback in the subsequent week, and the pace of outflows has continued since then, with this week’s outflow of USD -705 million staying on pace with that trend.
Figure: Recent history of FPI flows in debt
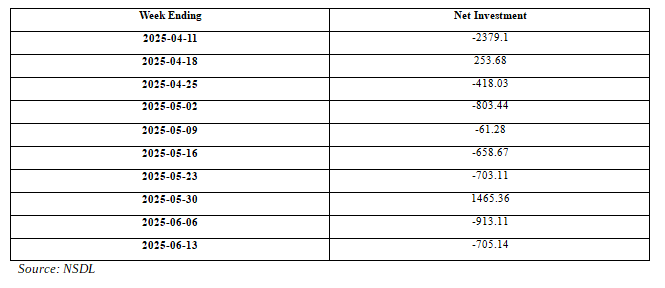
Figure: History of FPI flows in debt
How have the major indices, currencies and commodities performed?USD
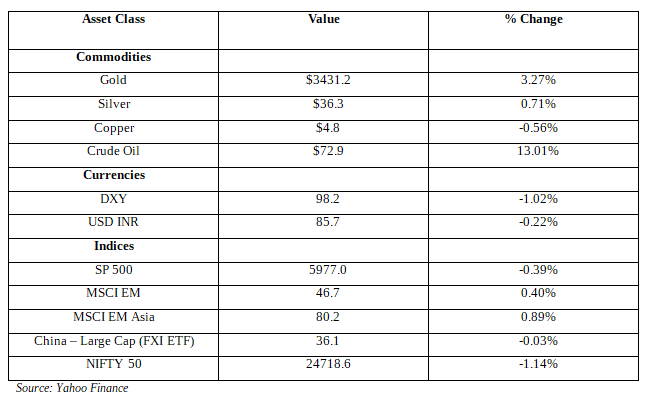
Emerging markets had a strong week with both MSCI EM and MSCI EM Asia witnessing gains. Taiwan and Korea witnessed strong gains in a week when other major markets witnssed a decline. India was among the worst performing markets and underperformed both US & EM.
Among asset classes, Gold shined. It was up 3.3% on increasing geopolitical gensions. Crude Oil spiked 13% as Israel attacked Iran, risking a disruption to the world’s oil supply. Separately, dollar index gained and INR appreciated against the USD.
In summary, the asset classes with the highest gains over the past week were Gold (3.27%), Crude Oil (13.01%), MSCI EM Asia (0.89%), and MSCI EM (0.40%). The asset classes with the largest declines were Dow Jones (-1.32%), Nasdaq (-0.63%), SP 500 (-0.39%) & Nifty 50 (-1.14%). Copper and China Large Cap (FXI ETF) had relatively small declines of -0.56% and -0.03%, respectively.
Figure: Performance of Key Indices, Currencies and Commodities
Significant FII outflows YTD
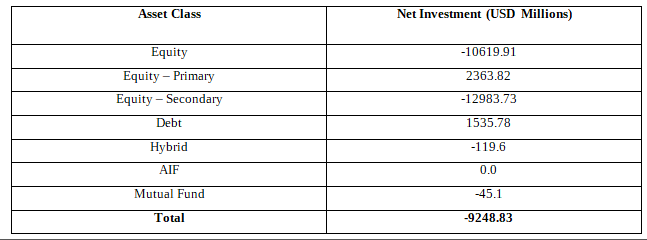
The year-to-date (YTD) FII flows depict a negative picture for equities. Debt funds have received a net of USD 1,535.78 million. IPOs have seen a net inflow of USD 2,363.82 million, indicating that FIIs are selectively considering opportunities. On the other hand, secondary equity markets have seen huge outflows of USD 12,983.7 million, indicating profit-taking and portfolio rebalancing. Cumulatively, the net FII outflow in equity markets now stands at -USD 10,619.9 million, suggesting a cautious stance towards Indian equities. Mutual fund and hybrid investments have also witnessed marginal outflows, AIFs too have experienced almost flat investments. The diverging trends in asset classes reflect the mixed sentiments of FIIs about Indian markets and their partial preferential liking for debt and IPOs.
Figure: YTD FPI/FII flows
Related Tags
![]() IIFL Customer Care Number
IIFL Customer Care Number
(Gold/NCD/NBFC/Insurance/NPS)
1860-267-3000 / 7039-050-000
![]() IIFL Capital Services Support WhatsApp Number
IIFL Capital Services Support WhatsApp Number
+91 9892691696
Download The App Now
Follow us on
2026, IIFL Capital Services Ltd. All Rights Reserved
IIFL Capital Services Limited - Stock Broker SEBI Regn. No: INZ000164132 (Member ID - NSE: 10975 BSE: 179 MCX: 55995 NCDEX: 01249), DP SEBI Reg. No. IN-DP-185-2016, IA SEBI Regn. No: INA000000623, Merchant Banker SEBI Regn. No. INM000010940, RA SEBI Regn. No: INH000000248, BSE Enlistment Number (RA): 5016, AMFI-Registered Mutual Fund Distributor & SIF Distributor
ARN NO : 47791 (Date of initial registration – 17/02/2007; Current validity of ARN – 08/02/2027), PFRDA Reg. No. PoP 20092018, IRDAI Corporate Agent (Composite) : CA1099

This Certificate Demonstrates That IIFL As An Organization Has Defined And Put In Place Best-Practice Information Security Processes.


