

FIIs withdrew INR 40 bn from equities last week. This was the worst in more than 8 weeks. Disappointing earnings from TCS and Axis likely led to the profit booking in FII heavy IT and Private Banks. However, FII inflows into debt picked up after the prior week’s weakness.
An analysis of global markets also shows that Indian equities have underperformed significantly last week. Relative rotation into better-performing markets like US and Tech heavy Taiwan/Korea are also impacting FII flows in India.
FPI flows for the week
There is a dichotomy in the FII flows for the week with the equity and debt markets showing contrasting trends. Even as FIIs withdrew INR 40.86 billion from equities side, they invested INR 29.3 billion into debt; indicating that the preference for debt continues. The outflow from equities was predominantly due to secondary equities that witnessed a considerable outflow of INR 50.01 billion, partially mitigated by a modest inflow of INR 9.16 billion in primary equities. The hybrid and mutual-fund categories too saw small outflows. In summary, it was another lacklustre week for FII flows with FIIs withdrawing INR 12.1 from Indian markets.
Figure: YTD FPI/FII flows for the week ending 2025-07-18
| Asset Class | Net Investment (INR Billions) |
| Equity | -40.9 |
| Equity – Primary | 9.2 |
| Equity – Secondary | -50 |
| Debt | 29.3 |
| Hybrid | -0.3 |
| AIF | 0 |
| Mutual Fund | -0.3 |
| Total | -12.1 |
Source: NSDL
A weekly history of FPI flows:
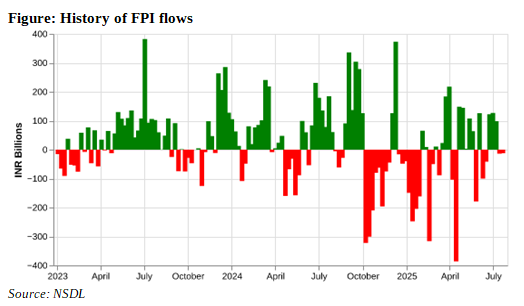
Last week, FIIs withdrew INR 12 billion from India. This is lower than the 3 year weekly average inflow of INR 25bn. However, it is still an improvement from the YTD statistics. YTD, average weekly outflows from FIIs were at INR 20 billion.
An analysis of the past 10 weeks indicates that FII flows have been negative for the second consecutive week. After significant inflows in June, FIIs have withdrawn from Indian markets in July. Overall, FII flows were positive in 5 of the past 10 weeks and negative in the rest.
Figure: Recent history of FPI flows
| Week Ending | Net Investment (INR Billions) |
| 16-05-2025 | 63.7 |
| 23-05-2025 | -178.9 |
| 30-05-2025 | 126.5 |
| 06-06-2025 | -100.3 |
| 13-06-2025 | -41.7 |
| 20-06-2025 | 122.2 |
| 27-06-2025 | 126.6 |
| 04-07-2025 | 98.8 |
| 11-07-2025 | -13.5 |
| 18-07-2025 | -12.1 |
Source: NSDL
A weekly history of FPI flows in Equity:
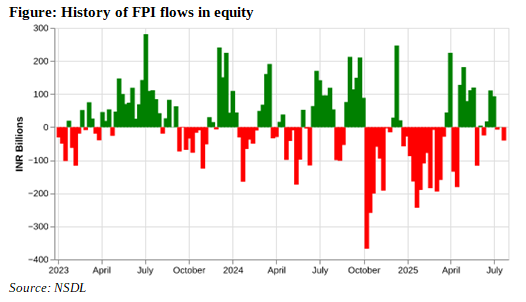
The FII/FPI net investment of INR -40 billion in the latest week is substantially lower than the long-term average weekly net investment of INR 6 billion and the year-to-date average weekly net investment of INR -29 billion. Compared to the last few weeks, the week under review has seen a considerable slippage in the net investment level as it fell sharply from INR 0.72 billion recorded during the previous week. It was the worst FII flow (highest outflow) in the past 8 weeks.
The worst of the FII flows in Equity happened at the beginning of the year when Indian markets witnessed significant outflows. However, since May 2025, they have improved. While last week’s number was negative, FII inflows into equities were positive in 6 of the past 10 weeks.
Figure: Recent history of FPI flows in equity
| Week Ending | Net Investment (INR Billions) |
| 2025-05-16 | 119.4 |
| 2025-05-23 | -116.7 |
| 2025-05-30 | 4.3 |
| 2025-06-06 | -24.8 |
| 2025-06-13 | 17.1 |
| 2025-06-20 | 110.5 |
| 2025-06-27 | 93.1 |
| 2025-07-04 | -7.3 |
| 2025-07-11 | 0.7 |
| 2025-07-18 | -40.9 |
Source: NSDL
A weekly history of FPI flows in Debt:
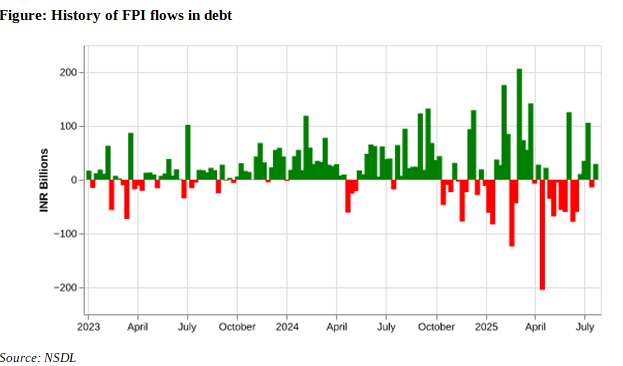
Last week, FII/FPI inflows into debt instruments improved to INR 29 billion. This is higher than the long term weekly average as well as the 2025 weekly average. It is also a sharp recovery from the previous week’s selling of INR 14.55 billion. FII flows into debt offset the outflows seen in equities during 2025. While the outflows from debt have picked up since May and June, they have improved recently. 4 of the past 5 weeks witnessed FII inflows into debt.
Figure: Recent history of FPI flows in debt
| Week Ending | Net Investment (INR Billions) |
| 2025-05-16 | -56.1 |
| 2025-05-23 | -60.2 |
| 2025-05-30 | 125.3 |
| 2025-06-06 | -78.2 |
| 2025-06-13 | -60.3 |
| 2025-06-20 | 10.8 |
| 2025-06-27 | 35.3 |
| 2025-07-04 | 105.8 |
| 2025-07-11 | -14.6 |
| 2025-07-18 | 29.3 |
Source: NSDL
How have the major indices, currencies and commodities performed?
Last week was marked by a mixed performance across asset classes. In the commodities space, Copper (+0.29%) was the only gainer, while Gold (-0.09%), Silver (-1.17%), and Crude Oil (-1.62%) declined.
Equity markets showed a divergent performance. The US markets were led by the Nasdaq (+1.51%), which rallied strongly, followed by the S&P 500 (+0.59%). However, the Dow Jones (-0.07%) was marginally down. In the emerging markets, MSCI EM (+1.70%) and MSCI EM Asia (+2.08%) rallied, driven by strong gains in the Hang Seng (+2.84%) and TAIEX (+2.78%) indices. The KOSPI (+0.39%) also gained, while the Nifty 50 (-0.72%) declined.
In the currency markets, the US dollar appreciated, with the DXY (+0.64%).
Figure: Performance of Key Indices, Currencies and Commodities
| Asset Class | Value | % Change |
| Commodities | ||
| Gold | 3353.0 | -0.1 |
| Silver | 38.2 | -1.2 |
| Copper | 5.6 | 0.3 |
| Crude Oil | 67.3 | -1.6 |
| Currencies | ||
| DXY | 98.5 | 0.6 |
| USD INR | 86.0 | 0.4 |
| Indices | ||
| SP 500 | 6296.8 | 0.6 |
| NASDAQ | 20895.7 | 1.5 |
| MSCI EM | 49.1 | 1.7 |
| MSCI EM Asia | 84.6 | 2.1 |
| KOSPI | 3188.1 | 0.4 |
| TAIEX | 23383.1 | 2.8 |
| Hang Seng | 24825.7 | 2.8 |
| NIFTY 50 | 24968.4 | -0.7 |
Source: Yahoo Finance
YTD FPI flows
YTD, Indian markets have witnessed significant FII outflows. Overall, FII outflows amounted to INR 481 billion. However, there was a marked divergence across asset classes. While equities witnessed outflow of INR 772.91 billion, debt witnessed an inflow of INR 307 billion; indicating a strong preference for debt amongst FIIs. Even among equities, FIIs had been interested in IPOs. Primary market showed an influx of INR 277 billion while secondary equities witnessed outflows of INR 1050 billion. Mutual Fund asset class also saw marginal outflow.
Figure: YTD FPI/FII flows
| Asset Class | Net Investment (INR Billions) |
| Equity | -772.9 |
| Equity – Primary | 277.2 |
| Equity – Secondary | -1050.1 |
| Debt | 307.0 |
| Hybrid | -14.3 |
| AIF | 0.0 |
| Mutual Fund | -0.7 |
| Total | -480.9 |
Source: NSDL
Related Tags
![]() IIFL Customer Care Number
IIFL Customer Care Number
(Gold/NCD/NBFC/Insurance/NPS)
1860-267-3000 / 7039-050-000
![]() IIFL Capital Services Support WhatsApp Number
IIFL Capital Services Support WhatsApp Number
+91 9892691696
Download The App Now
Follow us on
2026, IIFL Capital Services Ltd. All Rights Reserved
IIFL Capital Services Limited - Stock Broker SEBI Regn. No: INZ000164132 (Member ID - NSE: 10975 BSE: 179 MCX: 55995 NCDEX: 01249), DP SEBI Reg. No. IN-DP-185-2016, PMS SEBI Regn. No: INP000002213, IA SEBI Regn. No: INA000000623, Merchant Banker SEBI Regn. No. INM000010940, RA SEBI Regn. No: INH000000248, BSE Enlistment Number (RA): 5016, AMFI-Registered Mutual Fund Distributor & SIF Distributor
ARN NO : 47791 (Date of initial registration – 17/02/2007; Current validity of ARN – 08/02/2027), PFRDA Reg. No. PoP 20092018, IRDAI Corporate Agent (Composite) : CA1099

This Certificate Demonstrates That IIFL As An Organization Has Defined And Put In Place Best-Practice Information Security Processes.


