

ARE GLOBAL BOND YIELDS RISING GLOBALLY?
The concerns are not so much visible in the 10 year bond yields, which is the general benchmark for bond markets. We are seeing problems in the longer-term 30-year bond yields. Over the last 5 years, the bond yields in two of the largest economies in the world; the US and Japan have risen sharply; as is evident in the chart below.
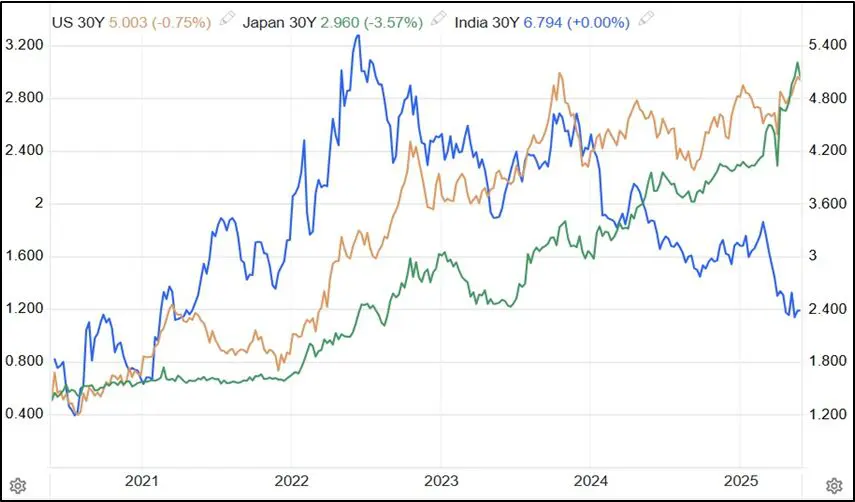
Chart Source: Trading Economics
In the last 5 years, the 30-year bond yield in the US has gone up from around 1.4% to 5.0%; while the 30-year bond yield in Japan has gone up from 0.5% to 3.0%. In the same period, the Indian 30-year bond yields have spiked till 2022; but since then, the yields are trending down. That could also be due to the fact that Indian 30-year bonds are not as widely traded as it is in the US and Japan. What exactly has driven this bond yield spike in the US and Japan in recent weeks?
WHAT IS DRIVING BOND YIELD SPIKE IN JAPAN AND THE US?
There are several reasons for the spike in the bond yields in both these nations. Here is a quick dekko.
In short, the higher bond yields are driven by higher inflation expectations, shift to shorter duration bonds, and concerns over burgeoning debt levels.
HAVE INDIAN STOCKS BEEN IMPACTED BY GLOBAL BOND YIELDS?
For starters, such a spike in bond yields makes Indian stocks more volatile. That has been the experience in the month of May 2025. Check the table below.
| Date | Open | High | Low | Close | Daily Returns | H/L Ratio |
| 26-May-25 | 24,919.35 | 25,079.20 | 24,900.50 | 25,001.15 | 0.60% | 0.72% |
| 23-May-25 | 24,639.50 | 24,909.05 | 24,614.05 | 24,853.15 | 0.99% | 1.20% |
| 22-May-25 | 24,733.95 | 24,737.50 | 24,462.40 | 24,609.70 | -0.82% | 1.12% |
| 21-May-25 | 24,744.25 | 24,946.20 | 24,685.35 | 24,813.45 | 0.52% | 1.06% |
| 20-May-25 | 24,996.20 | 25,010.35 | 24,669.70 | 24,683.90 | -1.05% | 1.38% |
| 19-May-25 | 25,005.35 | 25,062.95 | 24,916.65 | 24,945.45 | -0.30% | 0.59% |
| 16-May-25 | 25,064.65 | 25,070.00 | 24,953.05 | 25,019.80 | -0.17% | 0.47% |
| 15-May-25 | 24,694.45 | 25,116.25 | 24,494.45 | 25,062.10 | 1.60% | 2.54% |
| 14-May-25 | 24,613.80 | 24,767.55 | 24,535.55 | 24,666.90 | 0.36% | 0.95% |
| 13-May-25 | 24,864.05 | 24,973.80 | 24,547.50 | 24,578.35 | -1.39% | 1.74% |
| 12-May-25 | 24,420.10 | 24,944.80 | 24,378.85 | 24,924.70 | 2.32% |
Data Source: NSE
If you look at the last 10 trading session on the NSE, the daily returns have been negative on 5 days and positive on 5 days, with average returns of 0.03%. Similarly, if you look at the High / Low spread ratio over the last 11 days; it has been more than 1% on 7 out of the 11 days, of which on 2 days it has been above 2.0%. The average H/L variation stands at 1.28%, which is relatively high. The spike in bond yields globally may not have led to a market fall, but it has surely spiked volatility in the Indian markets.
WHY DO GLOBAL YIELDS IMPACT INDIAN MARKETS?
In the case of Japan and the US, the issue is not just with the borrowing, but also the fiscal deficit that the two economies run, in the range of 6.5% to 7.0% of GDP. Coming back to the India story, here is why Indian stocks are getting impacted.
That is why; Indian markets have seen a spike in volatility amidst rising bond yield in the US and Japan. That is also evident in the VIX spiking to 18.7 levels in this week.
Related Tags
![]() IIFL Customer Care Number
IIFL Customer Care Number
(Gold/NCD/NBFC/Insurance/NPS)
1860-267-3000 / 7039-050-000
![]() IIFL Capital Services Support WhatsApp Number
IIFL Capital Services Support WhatsApp Number
+91 9892691696
Download The App Now
Follow us on
2026, IIFL Capital Services Ltd. All Rights Reserved
IIFL Capital Services Limited - Stock Broker SEBI Regn. No: INZ000164132 (Member ID - NSE: 10975 BSE: 179 MCX: 55995 NCDEX: 01249), DP SEBI Reg. No. IN-DP-185-2016, PMS SEBI Regn. No: INP000002213, IA SEBI Regn. No: INA000000623, Merchant Banker SEBI Regn. No. INM000010940, RA SEBI Regn. No: INH000000248, BSE Enlistment Number (RA): 5016, AMFI-Registered Mutual Fund Distributor & SIF Distributor
ARN NO : 47791 (Date of initial registration – 17/02/2007; Current validity of ARN – 08/02/2027), PFRDA Reg. No. PoP 20092018, IRDAI Corporate Agent (Composite) : CA1099

This Certificate Demonstrates That IIFL As An Organization Has Defined And Put In Place Best-Practice Information Security Processes.


