
This inspection, conducted from March 10 through March 13, 2025, was to evaluate compliance with the legal standards concerning bioequivalence studies.

The company saw its revenues increase by 1.5% YoY at ₹3,374 crore from ₹3,324 crore.
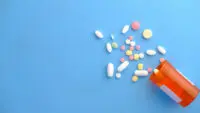
The serum contains liposomal azelaic acid, liposomal 4-butyl resorcinol, tranexamic acid, alpha arbutin, and niacinamide.
R&D expenses rose to ₹146.5 crore, making up 4.3% of total revenue, compared to ₹115.8 crore (3.4% of revenue) in the previous year.
This comes after competing private equity firms TPG Capital, Apax Partners, and KKR withdrew their original interest.
Alkem will conduct clinical trials of 'SON-080' in India, with Sonnet's support for global and local regulatory submissions.
According to sources, the floor price would be ₹5,616 per share, which is 3% lower than the current market price (CMP).
![]() IIFL Customer Care Number
IIFL Customer Care Number
(Gold/NCD/NBFC/Insurance/NPS)
1860-267-3000 / 7039-050-000
![]() IIFL Capital Services Support WhatsApp Number
IIFL Capital Services Support WhatsApp Number
+91 9892691696
Download The App Now
Follow us on
2026, IIFL Capital Services Ltd. All Rights Reserved
IIFL Capital Services Limited - Stock Broker SEBI Regn. No: INZ000164132, PMS SEBI Regn. No: INP000002213,IA SEBI Regn. No: INA000000623, SEBI RA Regn. No: INH000000248, DP SEBI Reg. No. IN-DP-185-2016, BSE Enlistment Number (RA): 5016
ARN NO : 47791 (AMFI Registered Mutual Fund & Specialized Investment Fund Distributor), PFRDA Reg. No. PoP 20092018

This Certificate Demonstrates That IIFL As An Organization Has Defined And Put In Place Best-Practice Information Security Processes.