Table of Content
Gann indicators are normally considered to be a lot more about mathematics and less about charts and technicals. However, Gann indicators have been used quite extensively in identifying opportunities in the stock markets, both at the index level and the stock level. Let us first understand the concept of Gann and the logic behind the Gann indicators.
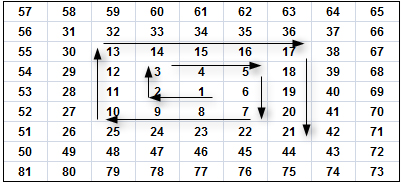
The above square is called the Gann square or the Gann Master Chart and is the basis of Gann based trading. This is not a random chart but is the number system that is created through concentric squares. See where the number 1 starts right at the centre and then gradually that pattern is followed all the way up to 81 where the 9X9 square ends. While this has been depicted for just 81 squares, you can expand it to 144 squares and so on. Essentially, if you look at the pattern of the consecutive numbers, it forms a spiral all the way from 1 to 81 with each spiral forming concentric squares/circles. The logical movement from 1 to 81 is in a clock-wise fashion.
Gann indicators adorned by the legendary trader W.D. Gann are a series of time-established devices and methods applied in predicting price movements on the foundation of geometric angles, time cycles, and past price patterns. Such indicators may provide useful information to both short-term and long-term traders:
Gann numbers assist traders in differentiating the important time cycles, which are significant in determining the best time to buy or sell. Using the historical time intervals, traders are able to predict the possible turning point in the market, which will enhance the accuracy of timing and minimise emotional decision-making.
Price and Trend Forecasting
Gann techniques entail the extrapolation of future prices on geometric angles and historical price trends. There are tools such as the Gann angles used to predict the strength and direction of the market trends. Thus, traders have a predictive advantage during a bearish or bullish market.
Traders are able to find important support and resistance areas with the assistance of such tools as the Gann Fan and Square of Nine. In most cases, these locations coincide with historical market tops or bottoms, and more specific trade entries and exits can be carried out on the basis of the historical price action.
Gann indicators have one of their strengths in flexibility. Gann tools can be used to fit different trading styles and time frames. Whether a day trader is using 5-minute charts or an investor analysing monthly data, the structure will always be consistent.
Gann charts are constructed based on price, time and geometry to predict market trends. These elements assist traders in determining important levels and when changes in the trends might occur.
The Gann Fan is a series of diagonal lines, which are drawn at certain angles (such as 1×1, 1×2, 2×1) relative to a centre point. These lines serve as support and resistance levels, and they are dynamic so that they help identify the direction and strength of the trend.
Gann Angles are mathematical instruments that indicate the correlation between price and time. The angle that is most valuable is the 1×1 (45-degree) angle, which is a representation of a balanced market. Angles steeper than 1×1 reflect the speeds at which the market moves faster or slower.
It is a spiral diagram that predicts the future support and resistance levels through the historical prices. It is also useful in time-price co-location, which can be used to identify important reversal areas and areas of trend continuity.
The Gann Wheel is a circular prediction instrument that incorporates both price and time and occasionally astrology. It is normally applied to trend forecasting in the long term and the determination of key market turning points.
The Gann analysis relies on time cycles. Traders may find it easier to predict future trends, and this is through the observation of the recurrence of periods like 30 days, 60 days, 90 days, or 180 days, and be able to predict in advance when a trend will turn or increase in speed.
The Gann Square of 9 is simply a tool that calculates time and price besides calculating the square root of numbers, including the mid points. The Gann Square basically looks for price and time alignments and is often used to forecast prices. Typically, the time alignment is used for swing trading, while the price alignment is used for forecasting prices and also for identifying supports and resistances of a stock.
In the entire enhanced Gann time-price squares indicator, it is the numbers on the cross and the diagonals that are really important from a forecasting point of view. For example, since the Gann Square is a perfect square it can also be represented as a circle that perfectly circumscribes the four corners of a square. Once that is done, the entire Gann Square is broken up into 8 equal parts of 45 degrees each. Since the circle has an angle of 360 degrees, each sector of 45 degrees will constitute one angle for the Gann Analysis. From a price and time forecasting point of view, the two most important lines are the Cardinal Cross and the Ordinal Cross. Let us focus on this Cardinal Cross and the Ordinal Cross more closely.

In the above Gann Square of 9X9 what are the important numbers from an analytical perspective? They are as follows:
In the above chart, the blue lines represent the Cardinal Cross and the yellow lines represent the Ordinal Cross. They are next in importance and represent the important supports and resistance levels for stocks. Effectively, the numbers along the blue line (cardinal cross) represent the strong supports and resistances, while the numbers along the yellow line (ordinal cross) represent the strong supports, which are liable to be breached.
Gann trading has never been proven to be scientifically workable but the patterns and the harmony in numbers that Gann has spoken about do have a lot of resonance not only in mathematics but also in most sciences ranging from trading, architecture, design, etc.
If the high price or the low price of a stock or index is made on Friday (last trading of the week), the next week is likely to see higher highs and lower lows, respectively, through a stock trading app.
In a strong uptrend, weekly lows are normally achieved on Tuesday, while in a strong downtrend the weekly highs are achieved on Wednesday.
Four weeks (1 month approximately) is a good indicator of reliable breach. If a four week high is breached or if a four week low is breached then indications are of more highs or more lows, respectively.
There are certain basic ratios that are held. For example, if the price trend is up for 9 days at a stretch then it is likely to correct for 5 days at a stretch (Ratio of 9:5). Double bottoms and triple bottoms on a monthly chart after a minimum gap of 6 months is an indication of a fresh uptrend.
Similarly, double tops and triple tops on the monthly charts after a minimum gap of 6 months is an indication of a fresh downtrend.
Normally, 50% of the last selling price is the strong support area for a stock. If it goes below that price then it is not useful for investment.
In terms of application, Gann theory can be used to trace and interpret 3 kinds of distinct patterns. These include Time Study, Price Study and Pattern Study. While the applicability of the Gann approach by itself is doubtful, it is a very important step in understanding patterns in trading.
Gann indicators offer a unique mix of mathematics, time analysis and geometry to forecast stock market movements. They are useful for getting valuable insights into market timing and trend direction. Traders use tools like Gann Square, Fan, and Angles to align time and prices for strategic decisions. All in all, Gann’s method is relevant for those who are seeking a structured and disciplined approach to understanding the market cycles and patterns.
Gann indicators are based on the idea that price, time and geometry are interconnected for predicting market movements. W.D. Gann believed that markets move in cycles and are influenced by natural laws and mathematical connections.
The Gann Square of 9 helps traders to identify support and resistance levels by aligning price with time. It uses square roots and angles to predict possible turning points in the market.
Yes, you can use Gann indicators for both short and long-term trading. Traders often use tools like the Gann Fan and time cycles for quick trend analysis.
The 1×1 angle, or 45-degree angle, represents a precise balance between price and time in Gann theory. It serves as a valuable indicator of trend strength and is often used to determine market direction.
![]() IIFL Customer Care Number
IIFL Customer Care Number
(Gold/NCD/NBFC/Insurance/NPS)
1860-267-3000 / 7039-050-000
![]() IIFL Capital Services Support WhatsApp Number
IIFL Capital Services Support WhatsApp Number
+91 9892691696
Download The App Now
Follow us on
2026, IIFL Capital Services Ltd. All Rights Reserved
IIFL Capital Services Limited - Stock Broker SEBI Regn. No: INZ000164132 (Member ID - NSE: 10975 BSE: 179 MCX: 55995 NCDEX: 01249), DP SEBI Reg. No. IN-DP-185-2016, PMS SEBI Regn. No: INP000002213, IA SEBI Regn. No: INA000000623, Merchant Banker SEBI Regn. No. INM000010940, RA SEBI Regn. No: INH000000248, BSE Enlistment Number (RA): 5016, AMFI-Registered Mutual Fund Distributor & SIF Distributor
ARN NO : 47791 (Date of initial registration – 17/02/2007; Current validity of ARN – 08/02/2027), PFRDA Reg. No. PoP 20092018, IRDAI Corporate Agent (Composite) : CA1099

This Certificate Demonstrates That IIFL As An Organization Has Defined And Put In Place Best-Practice Information Security Processes.