
Explore how overnight trading unlocks unique investment opportunities beyond regular market hours. Learn strategies to trade efficiently with india infoline.

Learn about key price action patterns and how they can enhance your trading strategies. Master market movements and make informed decisions with India Infoline's guide.

In financial terms, MTM or Mark to Market refers to the value of any asset as the current fair value after price or value fluctuations. Mark to Market is a method that aims to determine the real and fair value of a company’s financial situation based on the current market situation that is affecting the company’s performance.
If you’re new to precious metal investment, you might be unsure about the best approach. In this post, we’ll highlight the main difference between sovereign gold bond vs gold ETF, weigh the benefits and drawbacks of each, and arm you with all the knowledge you need to make an educated choice. So, let’s learn about the difference between gold ETF and sovereign gold bond in […]
India has stringent rules governing foreign exchange to control money flow and protect its economy. The Foreign Exchange Regulation Act and the Foreign Exchange Management Act are the two main laws that control foreign exchange transactions in India. These regulations guarantee the preservation of the nation’s foreign exchange reserves and the oversight of all cross-border transactions. So, let’s explore FEMA and FERA difference in detail. […]

A price band is the limit beyond which the price is not allowed to move on a particular day. For example, you may have seen stocks locked in 5% upper circuit or in 10% lower circuit. We recently got to see this quite frequently in stocks such as Vakrangee, PC Jewellers, and Manpasand Beverages.
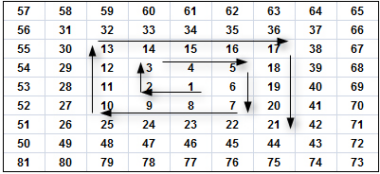
Gann indicators are normally considered to be a lot more about mathematics and less about charts and technicals. However, Gann indicators have been used quite extensively in identifying opportunities in the stock markets, both at the index level and the stock level.
Open interest (OI) is one of the key analytical tools that help one take a price view on stocks and even on the indices. Unlike equity shares that are limited by the number of shares issued, there is no such limit on open interest.
SEBI on Thursday notified a stricter set of insider trading norms to check illicit transactions in shares of listed firms by management personnel and 'connected persons'.
The concept of defining risk as 'R' can go a long way in allowing an investor to simplify his/her investment process. Look at the information below to further understand how you can trade successfully by defining risk as 'R'.
Gaps in stock market trading appear when there is sharp rise or fall in the price of the stock and when there is no occurrence of the trading activity. The reasons for gap creation can be a positive news release by the company, change in the trade analyst’s view, buying or selling pressure among traders, public announcements of the company’s profit, among others.
The word Marubozu is a candlestick pattern derived from the Japanese. By the appearance of the candle, there are no wicks and shadows present at the extreme ends.
Candlestick is one of the most important and widely used charts by technical analysts and day traders. It informs precisely about the high, low, opening, and closing price of a security in a day represented in the shape of a candlestick.
Authorized participants are entities that can issue and redeem shares of exchange-traded funds. They provide much of the liquidity of the ETF market, by raising the underlying assets needed to create ETF shares.
There exist multiple equity theories such as proprietary theory, entity theory, enterprise theory, residual equity theory, and so on. Each of these approaches presents different beneficiaries of the net receipts and different perspectives on the ways to prepare accounting records.


Click icons above to download App for Android or iOS
![]() IIFL Customer Care Number
IIFL Customer Care Number
(Gold/NCD/NBFC/Insurance/NPS)
1860-267-3000 / 7039-050-000
![]() IIFL Capital Services Support WhatsApp Number
IIFL Capital Services Support WhatsApp Number
+91 9892691696
Download The App Now
Follow us on
2026, IIFL Capital Services Ltd. All Rights Reserved
IIFL Capital Services Limited - Stock Broker SEBI Regn. No: INZ000164132 (Member ID - NSE: 10975 BSE: 179 MCX: 55995 NCDEX: 01249), DP SEBI Reg. No. IN-DP-185-2016, PMS SEBI Regn. No: INP000002213, IA SEBI Regn. No: INA000000623, Merchant Banker SEBI Regn. No. INM000010940, RA SEBI Regn. No: INH000000248, BSE Enlistment Number (RA): 5016, AMFI-Registered Mutual Fund Distributor & SIF Distributor
ARN NO : 47791 (Date of initial registration – 17/02/2007; Current validity of ARN – 08/02/2027), PFRDA Reg. No. PoP 20092018, IRDAI Corporate Agent (Composite) : CA1099

This Certificate Demonstrates That IIFL As An Organization Has Defined And Put In Place Best-Practice Information Security Processes.