Table of Content
A chart pattern manifests when the price of an asset moves in a direction similar to a common shape, such as a triangle, rectangle, head and shoulder, or, in this case, a cup and handle. These patterns visually represent a manner of trading. It provides a logical entry point, a stop-loss location for risk management, and a target price to close a profitable trade. This article highlights what is a cup and handle pattern in stocks, how to trade, and what to look out for, to increase your chances of winning the trade.
The cup and handle chart pattern on a security’s price chart is a technical indicator similar to a cup with a handle, where the bowl is U-shaped, and the handle moves slightly downwards. The cup and handle are considered bullish signals – the right-hand side of the pattern generally experiences lesser trade volume. The pattern’s formation can take as short as 7 weeks to as long as 65 weeks.
The cup and handle chart pattern was developed by William O’Neil and introduced in his 1988 book – ‘How to Make Money in Stocks’.
A cup and handle chart may show a reversal pattern or a continuation pattern. A reversal pattern occurs when the price is on a downtrend, in the long run, forming a bowl with a handle to reverse the trend and when the price starts to rise. A continuation pattern occurs during an uptrend. The price rises, forms a cup and handle, and then continues to rise.
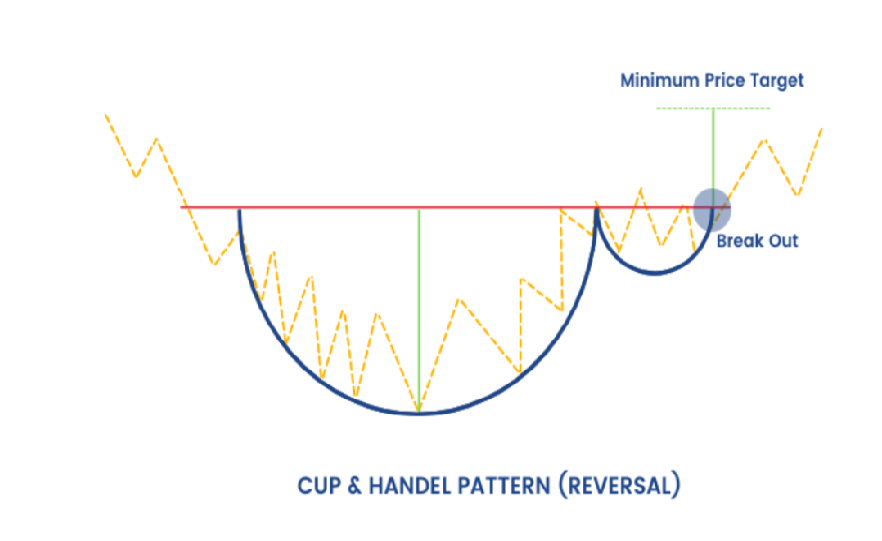
Source: elearnmarkets
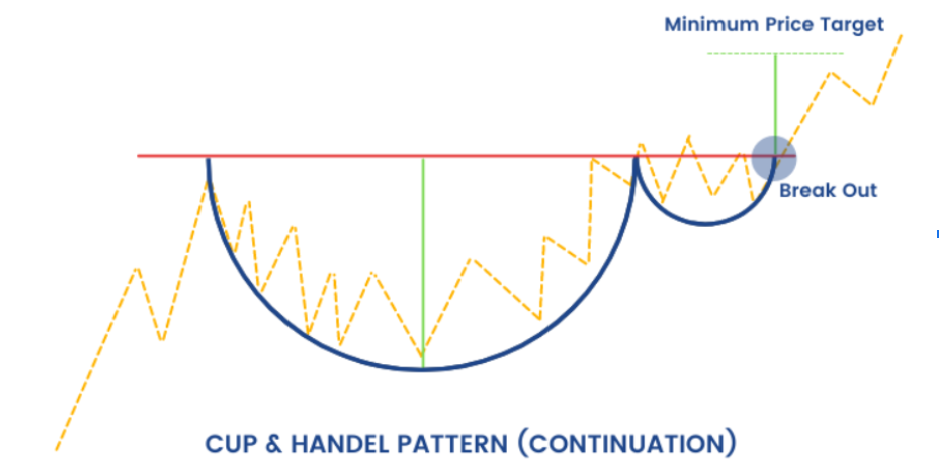
Source: elearnmarkets
It offers dealers precious views into the underlying market sentiments and potential future price fluctuations. Here are some things you can learn from this sample:
Trading the cup and handle demands close attention and a concrete strategy. Here’s a step-by-step on how one can effectively trade this pattern:
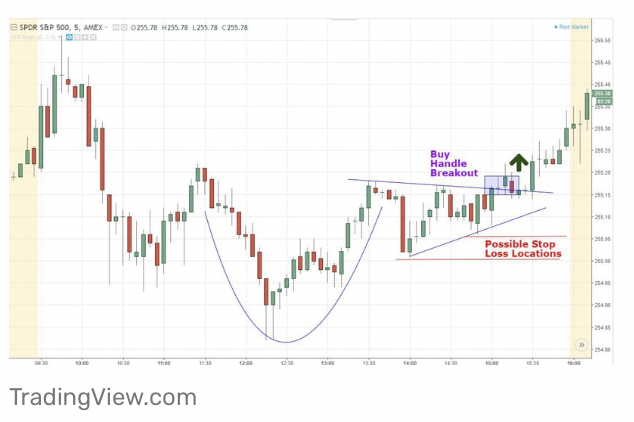
Consider finding a cup and handle pattern in the ABC Ltd. stock chart. First, it’s upward in a rounded shape known as a “cup”. Then comes a smaller decline referred to as a “handle”. The resistance point is around ₹200. When this breaks ₹200 with high trading volume, one may buy shares on this pattern, expecting further movement upwards.
The risk of the trade is managed by setting a stop-loss below the low of the handle, for example, at ₹190. In case of a breakout, the target profit may be set by the depth of the cup, which is often exited when the price hits about ₹230.
The cup and handle pattern is quite strong. But it does not come without certain shortcomings.
In a nutshell, here are the essential points to consider in evaluating and trading the cup and handle pattern:
Like any or all technical indicators, the cup and handle pattern should be used in nexus with other indicators before making a trading decision.
A cup and handle are considered a bullish signal extending toward an uptrend, and is used to spot opportunities to go long.
Consider a scenario where stocks recently peaked after a significant shock, but then corrected and fell nearly 50%. At this stage, investors can buy stocks in the hope that they will return to their previous levels. The stock tests a previous high resistance level to revert and then moves down in a consolidation trend. In the final phase of the pattern, stocks have crossed these resistance levels and surged 50% from their previous highs.
The cup and handle pattern usually performs well under various market conditions and time frames. When viewed correctly, the estimated success rate is around 65-75%. It’s considered somewhat reliable when compared with other technical indicators, but no pattern ever has a 100% chance of occurring.
The pattern can be anticipated by looking at the rounded “U” that is followed by a smaller depression, similar to a handle. Often, it follows an upward trend and, if supported by volume, confirms potential continuation if the price is broken above the resistance line of the handle.
Yes, the cup and handle pattern can fail if the breakout above the handle’s resistance does not hold. It can be a false signal in case of increased market volatility, weak volume during breakout, or some broader economic factors, and instead of continuation, the trend reverses.
![]() IIFL Customer Care Number
IIFL Customer Care Number
(Gold/NCD/NBFC/Insurance/NPS)
1860-267-3000 / 7039-050-000
![]() IIFL Capital Services Support WhatsApp Number
IIFL Capital Services Support WhatsApp Number
+91 9892691696
Download The App Now
Follow us on
2026, IIFL Capital Services Ltd. All Rights Reserved
IIFL Capital Services Limited - Stock Broker SEBI Regn. No: INZ000164132 (Member ID - NSE: 10975 BSE: 179 MCX: 55995 NCDEX: 01249), DP SEBI Reg. No. IN-DP-185-2016, PMS SEBI Regn. No: INP000002213, IA SEBI Regn. No: INA000000623, Merchant Banker SEBI Regn. No. INM000010940, RA SEBI Regn. No: INH000000248, BSE Enlistment Number (RA): 5016, AMFI-Registered Mutual Fund Distributor & SIF Distributor
ARN NO : 47791 (Date of initial registration – 17/02/2007; Current validity of ARN – 08/02/2027), PFRDA Reg. No. PoP 20092018, IRDAI Corporate Agent (Composite) : CA1099

This Certificate Demonstrates That IIFL As An Organization Has Defined And Put In Place Best-Practice Information Security Processes.