
Capital expenditure covers long-term investments in assets, while revenue expenditure includes daily operational costs. Learn more details at India Infoline.

Dividend Payout Ratio is percentage of a company’s net income distributed to shareholders as dividends. Learn how it is calculated with an example, importance of dividend payout ratio.

Learn about dividends, the different types, and their advantages and disadvantages. Understand how they affect share prices with our insight's at India Infoline.

Dividend Per Share (DPS) is the total dividend amount allocated to each outstanding share of a company. Learn how to calculate dividend per share effectively.

A dividend is a portion of a company’s profits distributed to its shareholders, typically in the form of cash, shares, or equivalents. Learn more at India Infoline.

Candlestick charts consist of several advanced versions. They showcase numerous forms of patterns and each of them has a distinct theory behind it. These patterns not only determine and evaluate the price movements in the market but also forecast them.
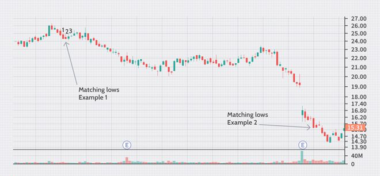
There are many ways to evaluate stocks but the most common practice followed by traders over time is technical analysis. This method identifies prevailing and reversal trends in the market and alerts traders as well.
Counterattack lines definition states that they are lines that indicate reversal patterns exhibiting two candlesticks going on contrary routes.
Technical analysis and candlestick patterns go hand-in-hand. The Candlestick chart is one of the highly used chart patterns due to the simplicity and clarity of information it provides.
The securities market works on the demand and supply and the stock prices move accordingly. There are tools and techniques used by traders and analysts to understand the possible price direction of securities.
The candlestick pattern is a widely used technical indicator among analysts and traders to predict the price movements in a security. A candlestick chart pattern conveys the four main price points: open, high, low, and close of a stock.
In the ocean of technical analysis, the candlestick chart pattern is the shark that rules. A technical analyst uses various charts, graphs, and patterns to find a hint of the potential direction of the stock price movement.
The greatest tool technical analysts use to predict the direction of stock price movements is candlestick chart patterns.
If you owned a portfolio company, you would prefer to keep the business going. Running out of business means, the company would struggle to pay off its debt or the required dividend to its shareholders.
A daily chart is a graphical representation of a stock’s price movements during a single trading day. A daily chart can be in the form of a bar, candlestick, or line chart.


Click icons above to download App for Android or iOS
![]() IIFL Customer Care Number
IIFL Customer Care Number
(Gold/NCD/NBFC/Insurance/NPS)
1860-267-3000 / 7039-050-000
![]() IIFL Capital Services Support WhatsApp Number
IIFL Capital Services Support WhatsApp Number
+91 9892691696
Download The App Now
Follow us on
2026, IIFL Capital Services Ltd. All Rights Reserved
IIFL Capital Services Limited - Stock Broker SEBI Regn. No: INZ000164132 (Member ID - NSE: 10975 BSE: 179 MCX: 55995 NCDEX: 01249), DP SEBI Reg. No. IN-DP-185-2016, PMS SEBI Regn. No: INP000002213, IA SEBI Regn. No: INA000000623, Merchant Banker SEBI Regn. No. INM000010940, RA SEBI Regn. No: INH000000248, BSE Enlistment Number (RA): 5016, AMFI-Registered Mutual Fund Distributor & SIF Distributor
ARN NO : 47791 (Date of initial registration – 17/02/2007; Current validity of ARN – 08/02/2027), PFRDA Reg. No. PoP 20092018, IRDAI Corporate Agent (Composite) : CA1099

This Certificate Demonstrates That IIFL As An Organization Has Defined And Put In Place Best-Practice Information Security Processes.