Sector | Daily(%) | 1 Week(%) | 1 Month(%) | 3 Months(%) | 6 Months(%) | 1 Year(%) |
|---|---|---|---|---|---|---|
Auto Ancillaries | 0.55 | -1.11 | 2.55 | 13.92 | 23.38 | 18.46 |
Capital Goods-Non Electrical Equipment | -0.02 | -1.20 | -0.79 | 10.41 | 21.13 | -4.19 |
IT - Hardware | 0.58 | -0.95 | -1.55 | 3.83 | 16.84 | 10.77 |
Marine Port & Services | 0.07 | -1.86 | 0.18 | 3.98 | 4.51 | -1.98 |
Mining & Mineral products | 0.80 | -1.00 | -5.25 | 2.13 | 8.20 | 10.31 |
Plywood Boards/Laminates | -0.01 | -0.42 | 2.73 | 12.44 | 10.67 | 0.94 |
Real Estate Investment Trusts | -0.03 | 0.90 | 4.39 | 3.43 | -0.03 | 12.29 |
Shipping | -0.49 | -0.59 | -3.31 | 5.23 | 29.81 | 28.16 |
Telecom-Handsets/Mobile | -1.16 | 4.84 | 36.82 | 50.77 | 45.48 | 1.14 |
Alcoholic Beverages | -0.40 | 0.83 | 3.74 | 2.23 | 9.60 | -2.47 |
Automobile | 0.23 | -0.92 | 0.34 | -0.84 | 4.57 | 18.17 |
Castings, Forgings & Fastners | 0.07 | 0.03 | 0.24 | 10.25 | 26.90 | 9.25 |
Cement - Products | 0.52 | -2.05 | 3.95 | 11.71 | 6.34 | -12.87 |
Ceramic Products | -0.44 | -2.01 | -4.91 | -1.58 | 6.03 | -17.18 |
Construction | 0.06 | -3.34 | -2.53 | -8.47 | -7.17 | -29.25 |
Diamond, Gems and Jewellery | 1.14 | 1.89 | 10.89 | 11.36 | 13.57 | 7.86 |
Diversified | 0.88 | -0.37 | 0.49 | 11.05 | 18.48 | -5.45 |
Electronics | 0.31 | -0.35 | 3.45 | 51.71 | 80.64 | 81.94 |
Insurance | 0.38 | -3.01 | -4.34 | -2.13 | -0.11 | -3.31 |
Power Generation & Distribution | 0.20 | -0.63 | -4.66 | 0.41 | 19.27 | 6.59 |
Refractories | 0.86 | -2.56 | 4.40 | 19.01 | 16.66 | 7.15 |
Aerospace & Defence | -0.53 | -3.06 | -6.84 | 20.09 | 44.64 | 39.31 |
Cables | 1.12 | -0.70 | -7.35 | 26.88 | 69.35 | 26.10 |
Cement | 0.97 | 1.55 | 0.99 | -3.46 | -6.98 | -20.50 |
Chemicals | 0.57 | 0.46 | 1.27 | 13.53 | 17.76 | -6.51 |
Entertainment | -0.06 | -2.64 | -5.95 | -5.60 | -9.29 | -24.42 |
Financial Services | -0.27 | 0.09 | -2.55 | -1.92 | 2.76 | -1.35 |
Infrastructure Investment Trusts | 0.18 | 0.50 | 2.75 | 3.28 | 5.06 | 3.99 |
Stock/ Commodity Brokers | -0.08 | -2.62 | -0.14 | 4.70 | 7.45 | -2.04 |
Tobacco Products | -0.11 | -2.83 | -12.89 | -17.10 | -19.21 | -38.17 |
Agro Chemicals | 0.19 | -0.48 | -0.05 | -2.18 | 0.76 | -30.19 |
Banks | 1.02 | -0.01 | 1.37 | 10.04 | 9.99 | 16.19 |
Capital Goods - Electrical Equipment | 0.03 | -1.30 | -5.35 | 6.32 | 37.09 | 7.69 |
Fertilizers | 0.01 | -2.42 | -5.80 | -6.16 | -7.99 | -22.89 |
Glass & Glass Products | -0.03 | -3.12 | 1.39 | 13.18 | 12.11 | -4.11 |
Leather | -0.38 | 0.85 | 1.92 | 6.72 | 5.04 | -19.13 |
Paper | 0.87 | -0.86 | -1.37 | -6.80 | -2.53 | -24.06 |
Readymade Garments/ Apparells | -0.83 | -1.78 | 0.13 | 6.13 | 13.57 | -18.22 |
Retail | 0.43 | -0.79 | -1.69 | 3.23 | 1.00 | -17.22 |
Sugar | 1.18 | -1.85 | -0.19 | -4.32 | 11.86 | -17.04 |
Telecom Equipment & Infra Services | 1.34 | -2.44 | -2.90 | 27.23 | 55.20 | 14.17 |
Trading | 0.16 | -1.93 | -4.05 | 2.61 | 11.77 | -8.12 |
Gas Distribution | 0.41 | -1.50 | -9.11 | 1.56 | 0.73 | -16.86 |
Healthcare | 0.70 | -1.00 | 0.86 | 11.85 | 16.01 | 7.28 |
Hotels & Restaurants | 0.28 | -1.22 | 0.75 | 4.09 | 1.74 | -22.01 |
IT - Software | -0.30 | -1.72 | 0.05 | 3.95 | -1.66 | -14.86 |
Logistics | 0.10 | -1.84 | -2.59 | 5.58 | 13.40 | -14.02 |
Packaging | -0.03 | 0.34 | 0.50 | 15.46 | 19.82 | -0.52 |
Realty | 0.21 | -2.41 | 0.50 | 3.13 | 2.75 | -14.54 |
Refineries | 0.54 | 4.26 | 7.69 | 10.90 | 12.81 | 12.48 |
Air Transport Service | -0.21 | -2.46 | 3.42 | 16.10 | 22.95 | -10.85 |
Computer Education | 1.61 | -4.13 | -5.22 | 9.56 | 8.09 | -23.59 |
E-Commerce/App based Aggregator | 0.36 | -1.08 | 5.51 | 9.35 | -0.90 | -7.04 |
Edible Oil | 0.67 | -2.22 | -7.70 | -5.19 | 4.59 | -11.16 |
Engineering | 0.23 | 0.64 | 1.99 | 19.88 | 55.06 | 5.14 |
Infrastructure Developers & Operators | -0.09 | -2.67 | -6.75 | 0.01 | 6.77 | -14.77 |
Media - Print/Television/Radio | -0.38 | -2.08 | -0.62 | -2.85 | -6.71 | -21.08 |
Oil Drill/Allied | -0.39 | -4.26 | 0.32 | 2.17 | 2.62 | -9.69 |
Plantation & Plantation Products | -0.09 | 2.41 | 4.24 | 4.59 | 13.05 | 2.01 |
Printing & Stationery | 0.08 | -2.38 | -3.95 | -6.12 | -7.24 | -24.79 |
Quick Service Restaurant | -0.06 | -5.02 | -6.11 | 16.26 | 30.37 | -9.19 |
Telecom-Service | 0.28 | -2.81 | -5.83 | 3.72 | 4.60 | -7.51 |
Textiles | 0.27 | -0.78 | -0.75 | 4.15 | 12.55 | -11.47 |
Tyres | -0.77 | -2.36 | -1.32 | -3.99 | -8.49 | -7.16 |
Bearings | 0.71 | -1.81 | -3.14 | 6.45 | 13.56 | 2.43 |
Consumer Durables | -0.08 | 0.19 | 1.39 | 8.79 | 16.57 | -3.97 |
Co-Working | 2.95 | -3.43 | 0.00 | 1.35 | -4.84 | -21.05 |
Crude Oil & Natural Gas | -0.39 | 1.32 | 2.43 | 0.92 | 19.17 | -2.17 |
Dry cells | 0.73 | -2.61 | -6.88 | 7.32 | -2.94 | -21.11 |
Ferro Alloys | 0.65 | -3.84 | -3.01 | -0.17 | 1.19 | 11.62 |
Finance | 0.34 | -1.06 | 1.57 | 7.37 | 6.67 | -1.97 |
FMCG | -0.03 | -1.19 | -0.10 | 4.45 | 9.96 | 5.98 |
Non Ferrous Metals | 0.38 | -2.16 | -5.72 | 0.60 | 13.70 | 35.43 |
Power Infrastructure | -1.45 | -2.12 | 4.10 | -5.68 | -3.22 | -22.92 |
Railways | -0.51 | -1.95 | -6.02 | -10.18 | -14.34 | -30.78 |
Ship Building | -0.41 | 0.73 | 5.86 | 33.35 | 31.39 | 386.84 |
Steel | -0.10 | -1.56 | -2.46 | 4.49 | 16.40 | 4.85 |
Credit Rating Agencies | 0.56 | 0.84 | -1.07 | -1.48 | -6.57 | -18.96 |
Education | 0.48 | -1.97 | -4.98 | 6.06 | -2.34 | -10.73 |
ETF | 0.14 | 0.11 | -0.25 | 0.08 | -0.28 | 10.51 |
Miscellaneous | -0.59 | -0.85 | -2.81 | 2.00 | 7.30 | -8.62 |
Paints/Varnish | 2.09 | 2.03 | -1.92 | 5.56 | -7.05 | -13.05 |
Petrochemicals | 0.74 | -0.17 | -2.32 | 18.78 | 21.69 | -13.19 |
Pharmaceuticals | -0.01 | -0.21 | 4.28 | 21.16 | 30.73 | 13.46 |
Plastic products | -0.64 | -0.28 | -2.40 | 1.09 | 1.95 | -16.30 |

The Indian stock market ended lower on 20 July 2026, with the Sensex dropping 442.93 points and the Nifty 50 slipping 95.80 points amid a sharp sell-off in private banking stocks following Q1 FY27 earnings. Explore today's market highlights, top gainers and losers, trending stocks, sector-wise performance, and the major factors that influenced market sentiment.
20 Jul 2026|06:57 PM
The National Stock Exchange (NSE) will launch derivatives on the Nifty India FPI 150 Index from August 12 after receiving SEBI approval. The new futures and options contracts are expected to strengthen risk management, improve market liquidity, and provide foreign investors with a diversified benchmark for Indian equities.
17 Jul 2026|10:10 AM
Indian benchmark indices ended largely unchanged on July 16, 2026, with IT and Auto stocks supporting the market while Realty and Financial Services lagged. Rising Brent crude prices, fresh US-Iran tensions, weak global cues, and profit booking ahead of the Q1 earnings season kept investor sentiment cautious despite selective sectoral gains.
16 Jul 2026|05:38 PM
Sensex and Nifty ended nearly flat after recovering from sharp early losses. A strong rally in TCS, HCL Tech, and the IT sector offset weakness in FMCG, metals, and defence stocks amid geopolitical concerns and higher crude oil prices.
13 Jul 2026|05:30 PM
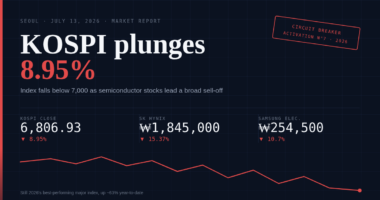
South Korea’s KOSPI index plunged 8.95% as semiconductor giants SK hynix and Samsung Electronics led a sharp market sell-off. The decline was driven by AI valuation concerns, geopolitical tensions, rising oil prices, and investor profit booking after SK hynix’s US ADR debut.
13 Jul 2026|04:12 PM

![]() IIFL Customer Care Number
IIFL Customer Care Number
(Gold/NCD/NBFC/Insurance/NPS)
1860-267-3000 / 7039-050-000
![]() IIFL Capital Services Support WhatsApp Number
IIFL Capital Services Support WhatsApp Number
+91 9892691696
Download The App Now
Follow us on
2026, IIFL Capital Services Ltd. All Rights Reserved
IIFL Capital Services Limited - Stock Broker SEBI Regn. No: INZ000164132 (Member ID - NSE: 10975 BSE: 179 MCX: 55995 NCDEX: 01249), DP SEBI Reg. No. IN-DP-185-2016, PMS SEBI Regn. No: INP000002213, IA SEBI Regn. No: INA000000623, Merchant Banker SEBI Regn. No. INM000010940, RA SEBI Regn. No: INH000000248, BSE Enlistment Number (RA): 5016, AMFI-Registered Mutual Fund Distributor & SIF Distributor
ARN NO : 47791 (Date of initial registration – 17/02/2007; Current validity of ARN – 08/02/2027), PFRDA Reg. No. PoP 20092018, IRDAI Corporate Agent (Composite) : CA1099

This Certificate Demonstrates That IIFL As An Organization Has Defined And Put In Place Best-Practice Information Security Processes.